Open Access
Fig. 13
Download original image
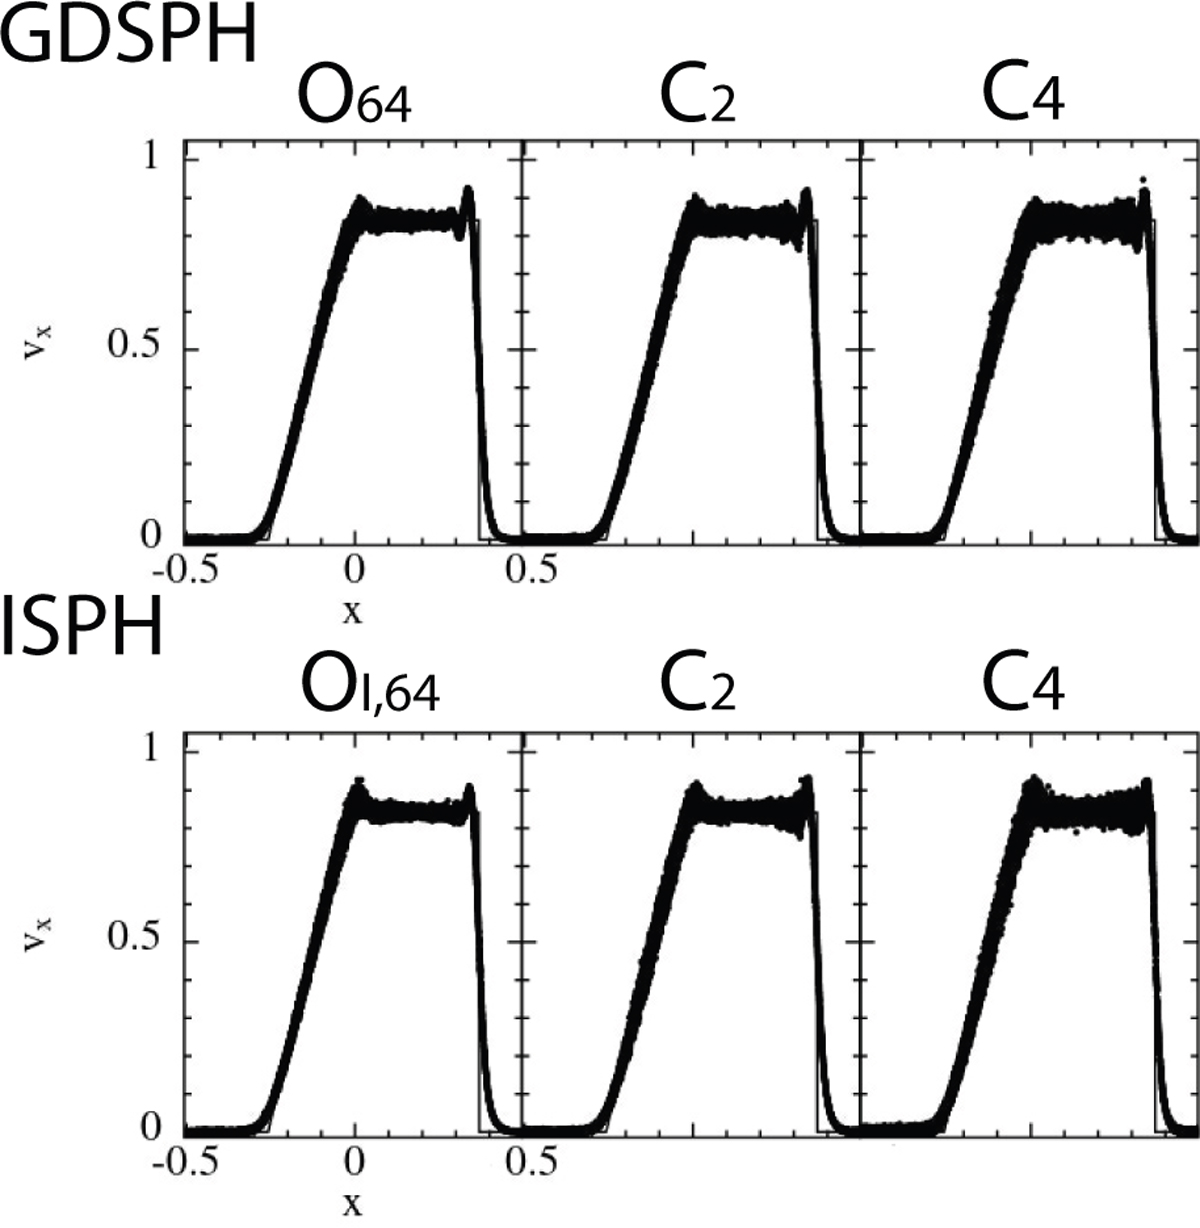
Velocity structure of the Sod-shocktube test at t = 0.2 performed at nx = 64 and Nsmooth = 64. The thin black line shows the exact solution. One can see that the optimized kernel exhibit less noise in the post-shock region compared to the C2 and C4 kernel.
Current usage metrics show cumulative count of Article Views (full-text article views including HTML views, PDF and ePub downloads, according to the available data) and Abstracts Views on Vision4Press platform.
Data correspond to usage on the plateform after 2015. The current usage metrics is available 48-96 hours after online publication and is updated daily on week days.
Initial download of the metrics may take a while.