Fig. 15
Download original image
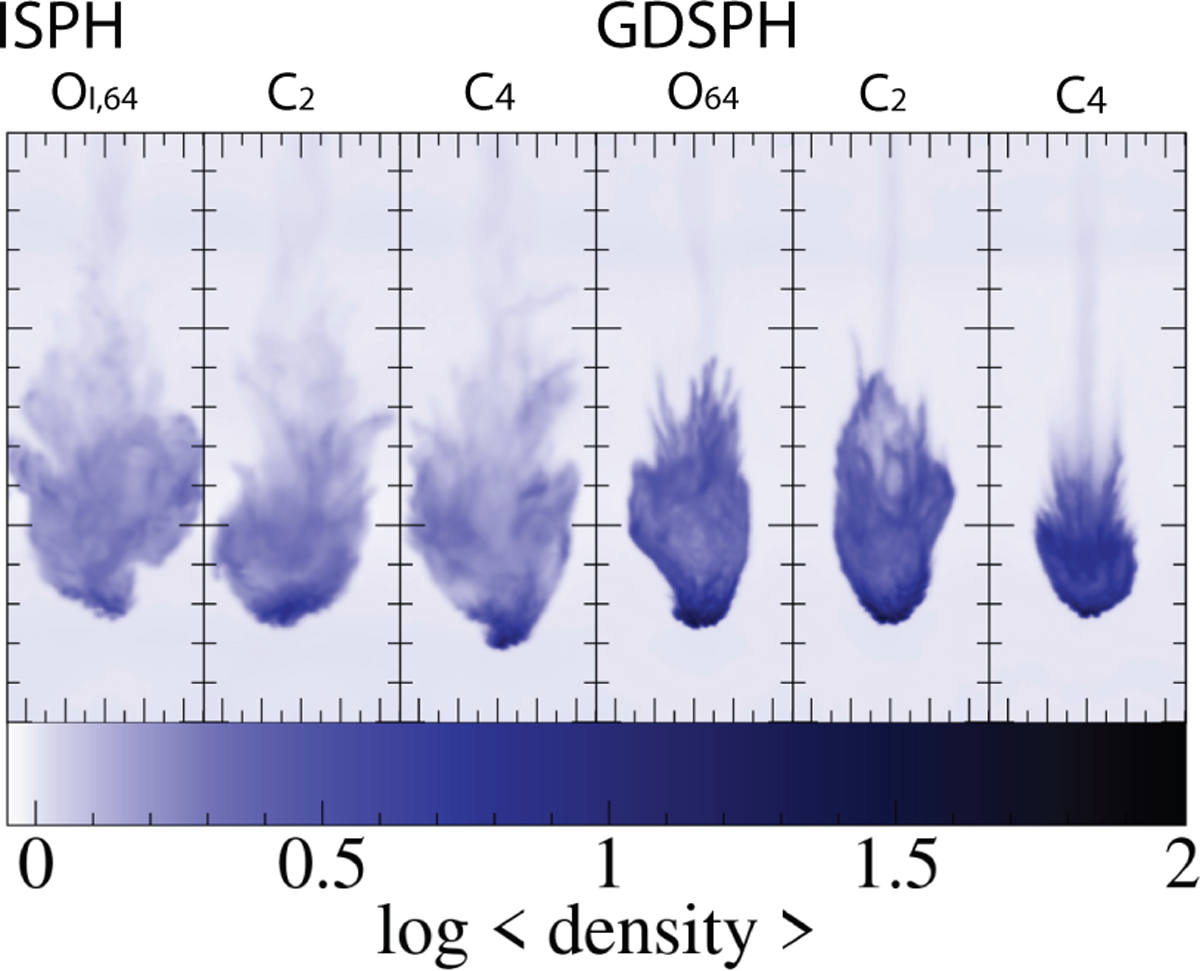
Density rendering of the subsonic blob test (∆ρ = 100, M = 0.5 Rcloud = 0.1) at t = 5tcrush with a resolution of nx = 64 in the low density medium. The three left columns depict the cloud state with the ISPH method and the kernels (OI,64, C2, C4), and three right columns show the GDSPH method and the kernels (O64, C2, C4). The X axis has a length of one, and Y axis has a length of three. One can see that the ISPH method disrupts and mixes the cloud more aggressively than the GDSPH method. We also observed that we increase mixing with the optimized kernels compared to the C2 and C4 kernel in both the GDSPH and ISPH method.
Current usage metrics show cumulative count of Article Views (full-text article views including HTML views, PDF and ePub downloads, according to the available data) and Abstracts Views on Vision4Press platform.
Data correspond to usage on the plateform after 2015. The current usage metrics is available 48-96 hours after online publication and is updated daily on week days.
Initial download of the metrics may take a while.