Fig. 5
Download original image
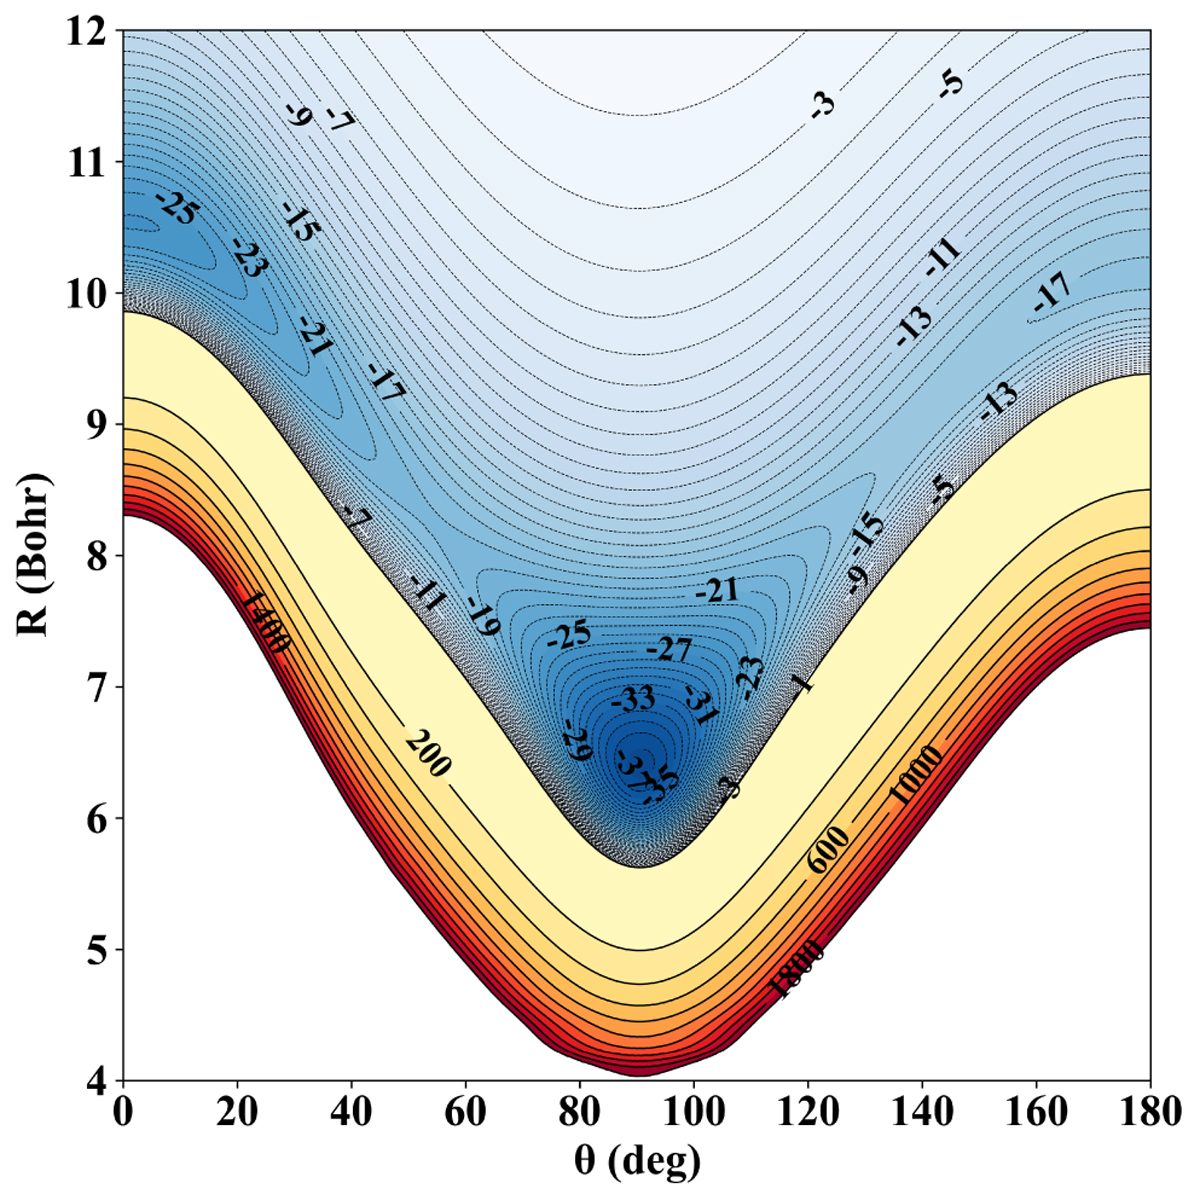
2D contour plot of the C4H–He 2D-PES as a function of the intermolecular distance (R) and the angular coordinate (θ). The energy values, expressed in inverse centimeters, are referenced with respect to the energy of the C4H + He system at the asymptotic dissociation limit. Negative energies are represented by blue contours with energy steps of 1 cm−1, while the positive energies are depicted using yellow and red contours with energy steps of 200 cm−1.
Current usage metrics show cumulative count of Article Views (full-text article views including HTML views, PDF and ePub downloads, according to the available data) and Abstracts Views on Vision4Press platform.
Data correspond to usage on the plateform after 2015. The current usage metrics is available 48-96 hours after online publication and is updated daily on week days.
Initial download of the metrics may take a while.