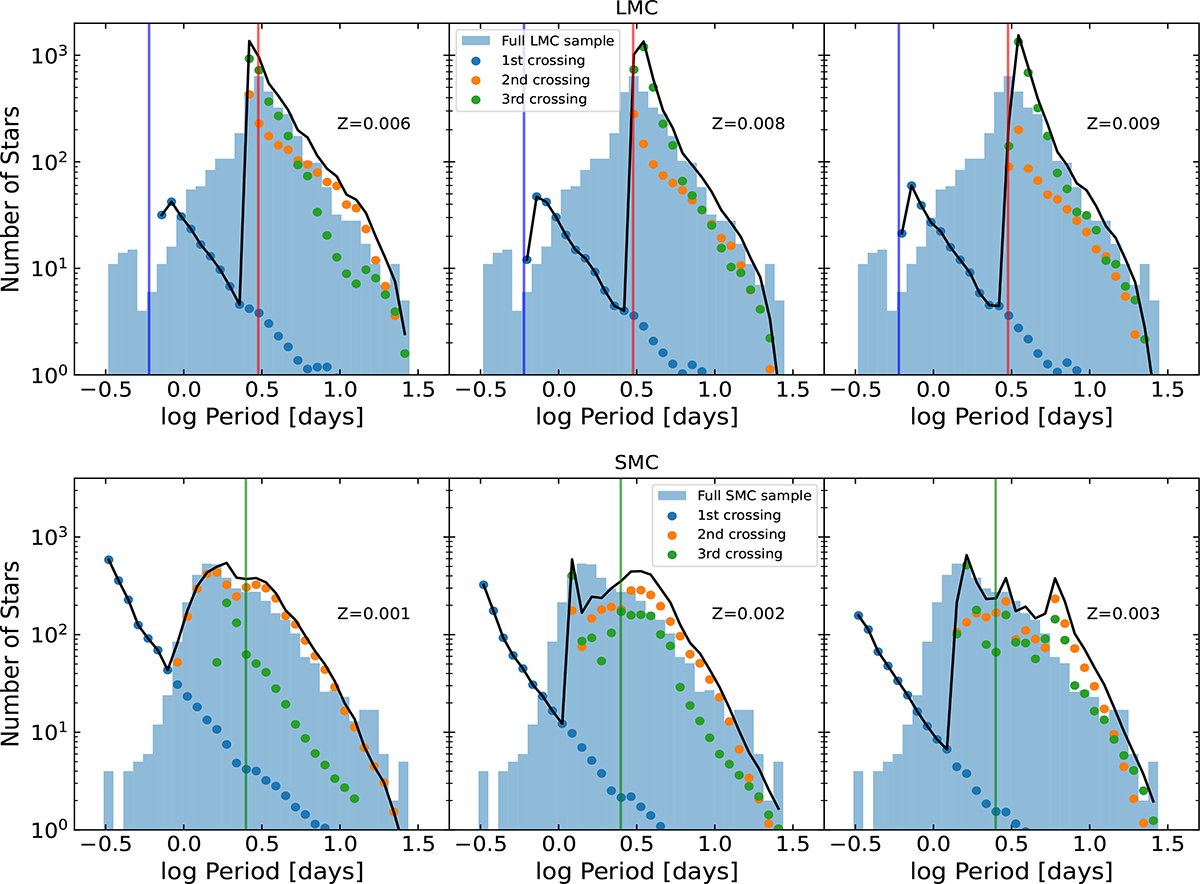
Fig. 5.
Download original image
Histogram of the number of LMC (upper panels) and SMC (lower panels) Cepheids, including F and 1O, as a function of fundamentalized pulsating period. The colored points show the expected number of Cepheids in each bin for different IS crossings, calculated using Eq. (1). The sum of the expected numbers of stars for all IS crossings is shown as a black solid line. The vertical blue, red, and green lines mark pulsation periods of 0.6 (the shortest period of our LMC models), 3, and 2.5 days, respectively.
Current usage metrics show cumulative count of Article Views (full-text article views including HTML views, PDF and ePub downloads, according to the available data) and Abstracts Views on Vision4Press platform.
Data correspond to usage on the plateform after 2015. The current usage metrics is available 48-96 hours after online publication and is updated daily on week days.
Initial download of the metrics may take a while.