Fig. 7.
Download original image
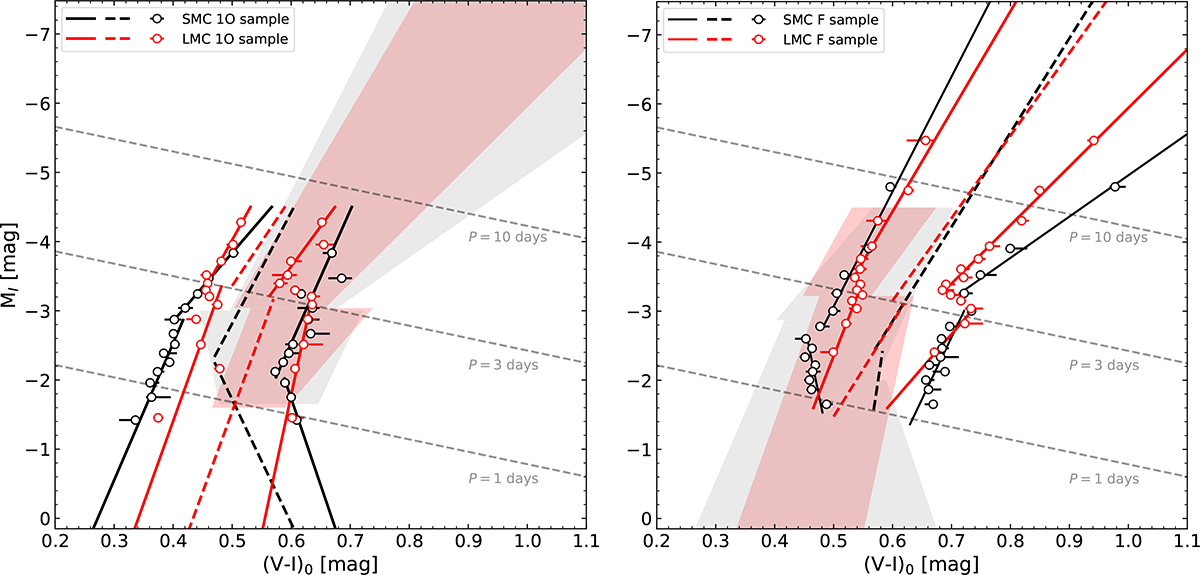
Comparison of empirical ISs of the LMC (Paper I) and SMC (this work) in red and black, respectively. The dashed lines represent the middle of the ISs. The left panel compares only the ISs for 1O Cepheids, while the right panel shows F ISs. The shaded areas show the IS for F mode in the left panel and for 1O mode in the right panel, allowing comparison between the modes and illustrating their superposition.
Current usage metrics show cumulative count of Article Views (full-text article views including HTML views, PDF and ePub downloads, according to the available data) and Abstracts Views on Vision4Press platform.
Data correspond to usage on the plateform after 2015. The current usage metrics is available 48-96 hours after online publication and is updated daily on week days.
Initial download of the metrics may take a while.