Fig. 1
Download original image
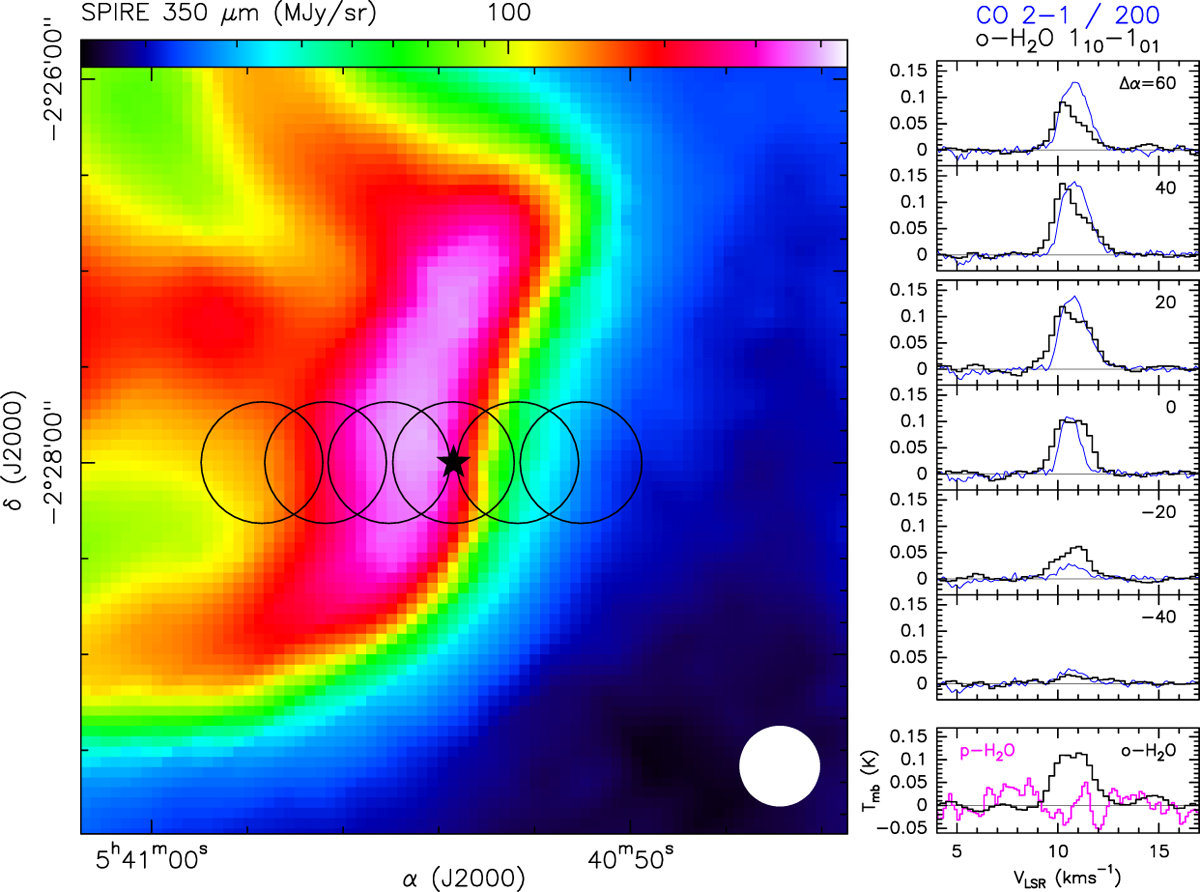
(Left panel) SPIRE 350 μm image of the Horsehead PDR. The white circle shows the FWHM SPIRE beam (25.2″). Black circles show the locations at which 557 GHz o-H2O spectra were obtained, with the circle size corresponding to the FWHM HIFI beam (38.1″). (Right panel) Spectra of the 557 GHz o-H2O and CO (2–1) lines across the PDR (black and blue curves, respectively), labeled by the right ascension offsets with respect to the reference position. The CO 2–1 spectra have been scaled down by a factor of 200. The bottom-right panel shows spectra of the ground state o– and p–H2O lines at the central position.
Current usage metrics show cumulative count of Article Views (full-text article views including HTML views, PDF and ePub downloads, according to the available data) and Abstracts Views on Vision4Press platform.
Data correspond to usage on the plateform after 2015. The current usage metrics is available 48-96 hours after online publication and is updated daily on week days.
Initial download of the metrics may take a while.