Fig. 11
Download original image
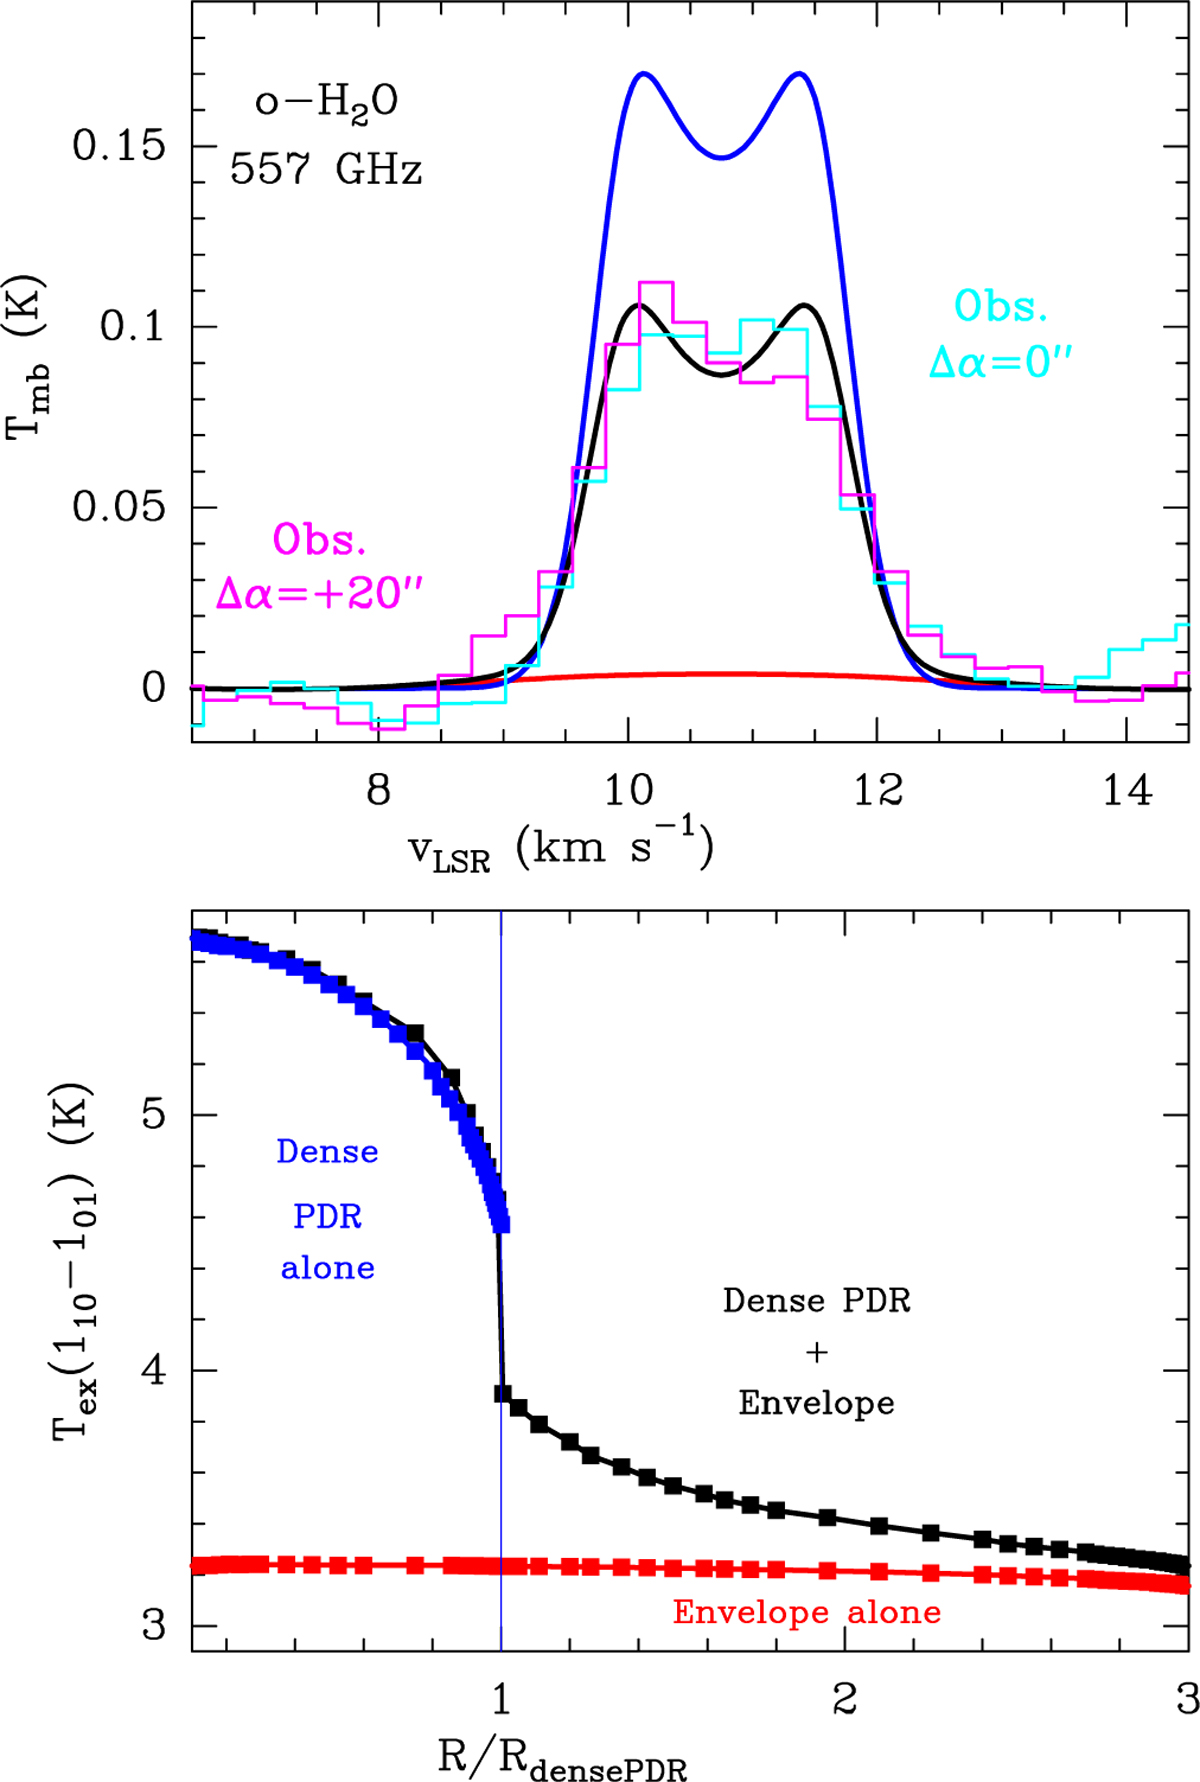
Two-component, nonlocal radiative transfer models adapted to the physical conditions in the Horsehead. The upper panel shows the o-H2O 557 GHz synthetic line profiles (continuous curves) and observed line profiles (histograms) at the emission peak. The lower panel shows the predicted excitation temperatures of the 110–101 transition. The blue curves represent the model of the dense PDR component alone. The red curves represent the model of the low-density envelope alone, while the black curves represent the two-component model.
Current usage metrics show cumulative count of Article Views (full-text article views including HTML views, PDF and ePub downloads, according to the available data) and Abstracts Views on Vision4Press platform.
Data correspond to usage on the plateform after 2015. The current usage metrics is available 48-96 hours after online publication and is updated daily on week days.
Initial download of the metrics may take a while.