Fig. C.2
Download original image
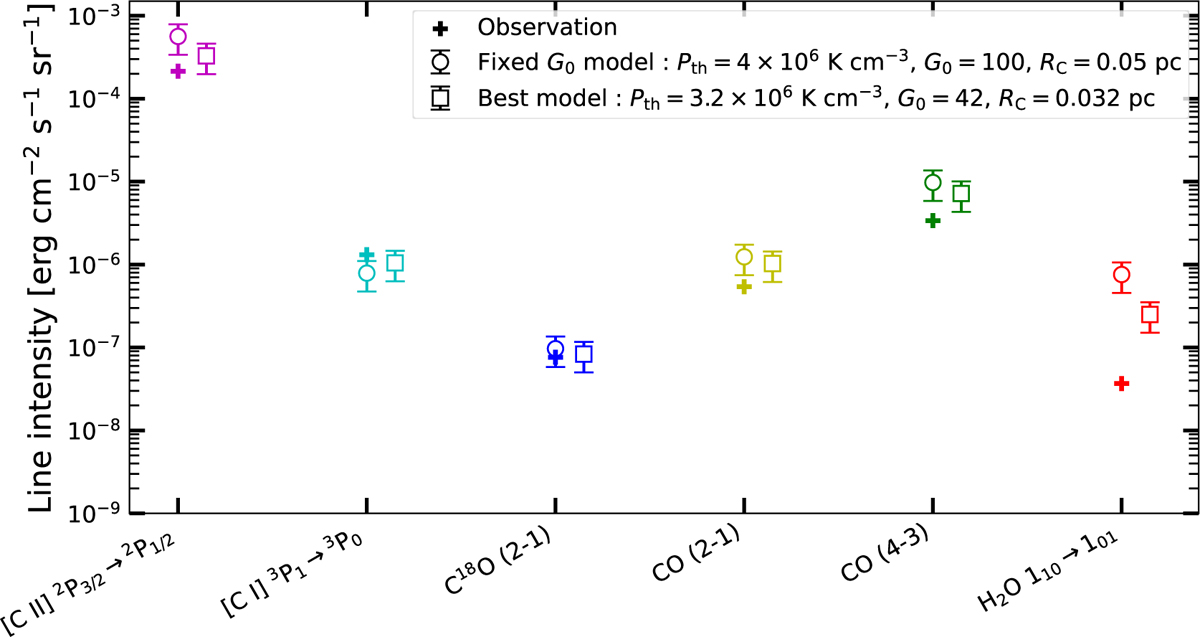
Observed maximum intensities of various tracers (colored crosses) compared with model predictions (symbols with error bars). Squares show the best-fit model from the minimization described in Appendix C, while circles represent the model obtained in Section 4.4 using literature parameters with G0 = 100. All tracers are well reproduced, except for H2O, for which the models over-predict the observed maximum intensity by about an order of magnitude. The error bars of 40% on models represent geometrical uncertainties and the complexity of the parameter space.
Current usage metrics show cumulative count of Article Views (full-text article views including HTML views, PDF and ePub downloads, according to the available data) and Abstracts Views on Vision4Press platform.
Data correspond to usage on the plateform after 2015. The current usage metrics is available 48-96 hours after online publication and is updated daily on week days.
Initial download of the metrics may take a while.