Fig. 2
Download original image
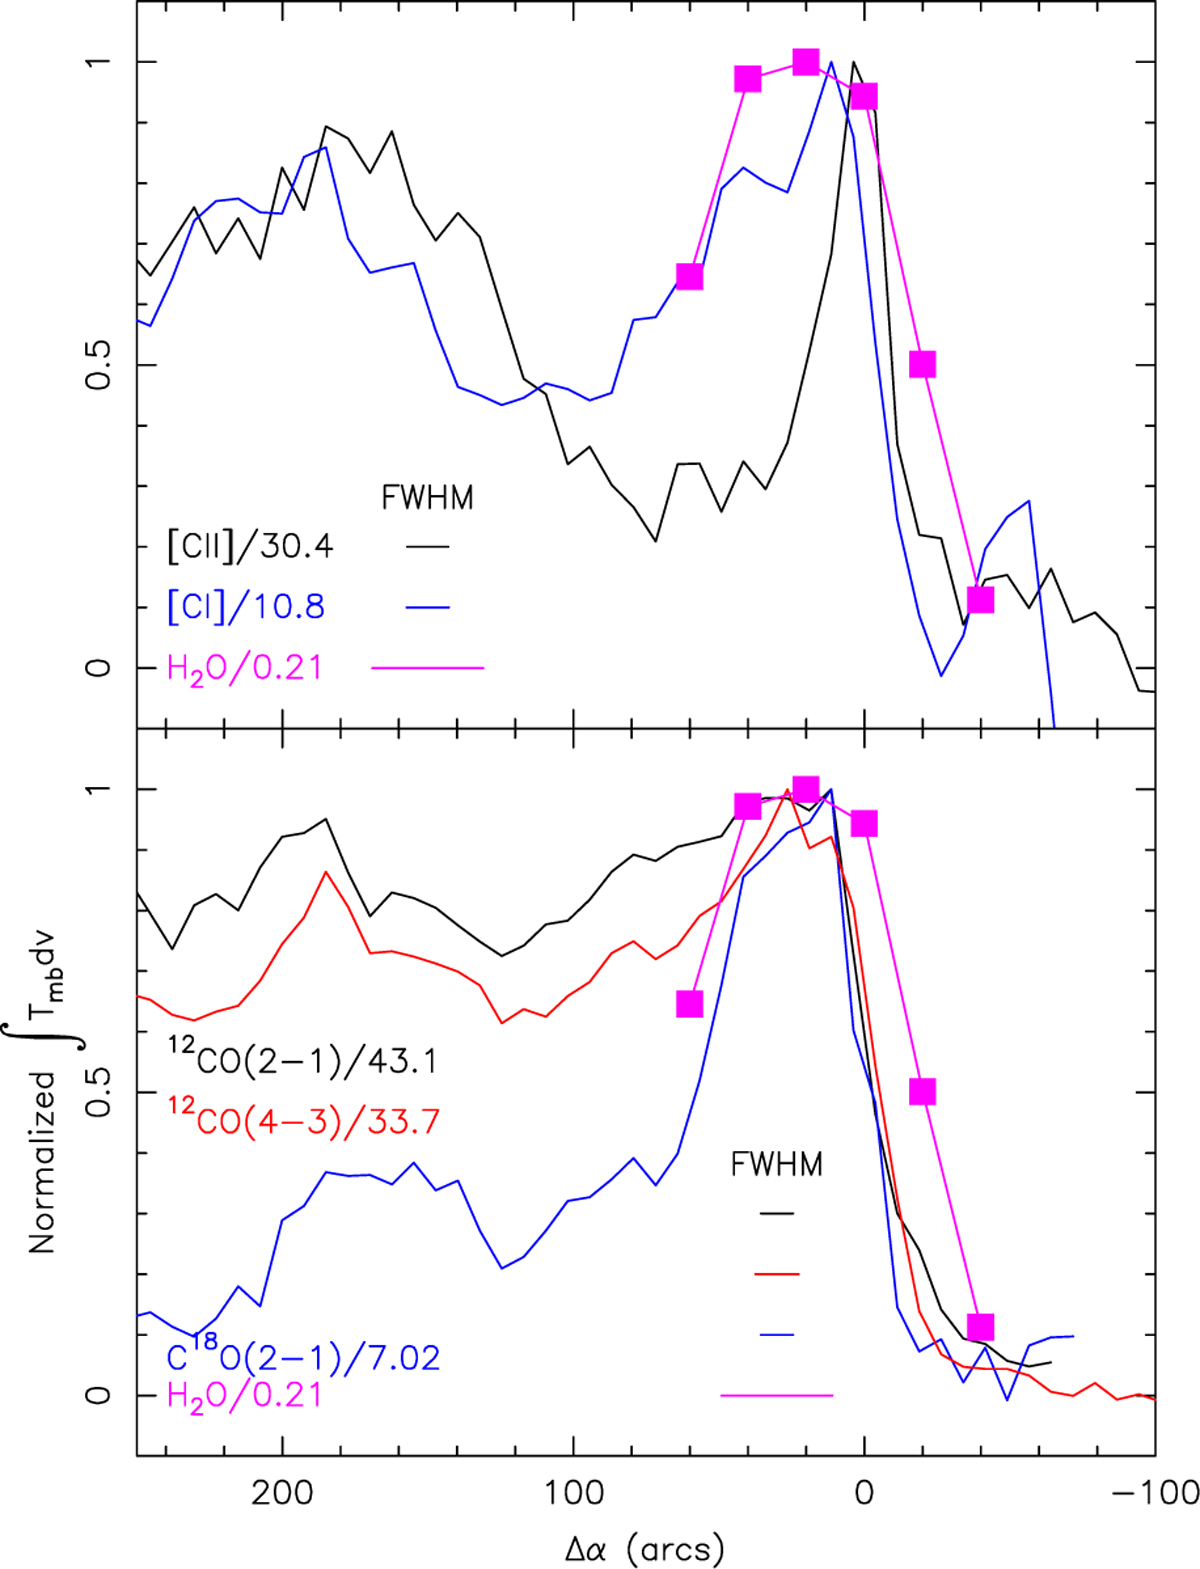
Integrated line intensities of atomic and molecular tracers computed over a 9.2–11.8 km s−1 velocity range across the PDR as a function of right ascension offset at Δδ = 0. (Top) [C II], [C I], and H2O (black, blue, and magenta, respectively). (Bottom) CO (2–1), C18O (2–1), CO (4–3), and H2O (black, blue, red, and magenta, respectively). Line intensities have been normalized to their maxima toward the PDR, with the corresponding scaling factors as labeled. The data are shown at the native resolution of the images, with the corresponding FWHM beam sizes marked for each tracer. The size of the squares corresponds approximately to ±1σ H2O observational uncertainties.
Current usage metrics show cumulative count of Article Views (full-text article views including HTML views, PDF and ePub downloads, according to the available data) and Abstracts Views on Vision4Press platform.
Data correspond to usage on the plateform after 2015. The current usage metrics is available 48-96 hours after online publication and is updated daily on week days.
Initial download of the metrics may take a while.