Fig. 6
Download original image
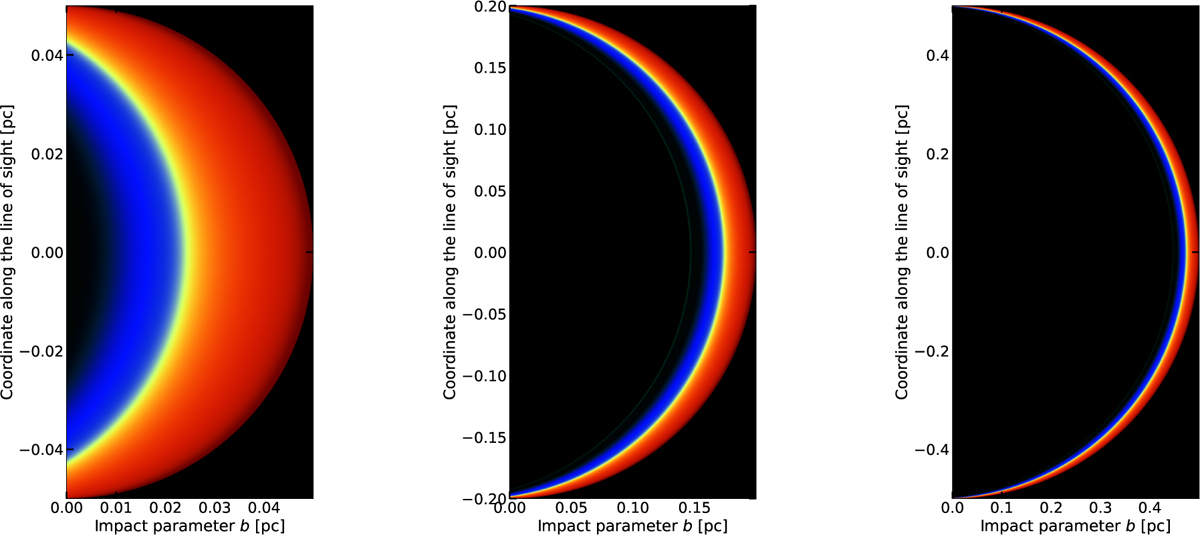
Illustration of the wrapper geometry, showing RGB composite maps of carbon-bearing species for different radii of curvature. The color encodes the local abundances as follows: red for ionized carbon (C+), green for neutral atomic carbon (C), and blue for carbon monoxide (CO). Areas where these species coexist appear as color blends (e.g., cyan for C and CO, yellow for C+ and C, white for equal contributions). The left panel shows a curvature radius of RC = 0.05 pc, the middle to RC = 0.2 pc, and the right to RC = 0.5 pc. These maps highlight the local spherical curvature in the plane of the sky, with the observer located at the bottom of each panel and the stellar radiation field entering from the right. Radiative transfer is computed along vertical lines from top to bottom in this configuration. The abundances originate from a single Meudon PDR model (Pth = 4 × 10⁶ K cm−3, G0 = 100). The usual edge-on representation of abundances of this model can be found in Figure 10.
Current usage metrics show cumulative count of Article Views (full-text article views including HTML views, PDF and ePub downloads, according to the available data) and Abstracts Views on Vision4Press platform.
Data correspond to usage on the plateform after 2015. The current usage metrics is available 48-96 hours after online publication and is updated daily on week days.
Initial download of the metrics may take a while.