Fig. 8
Download original image
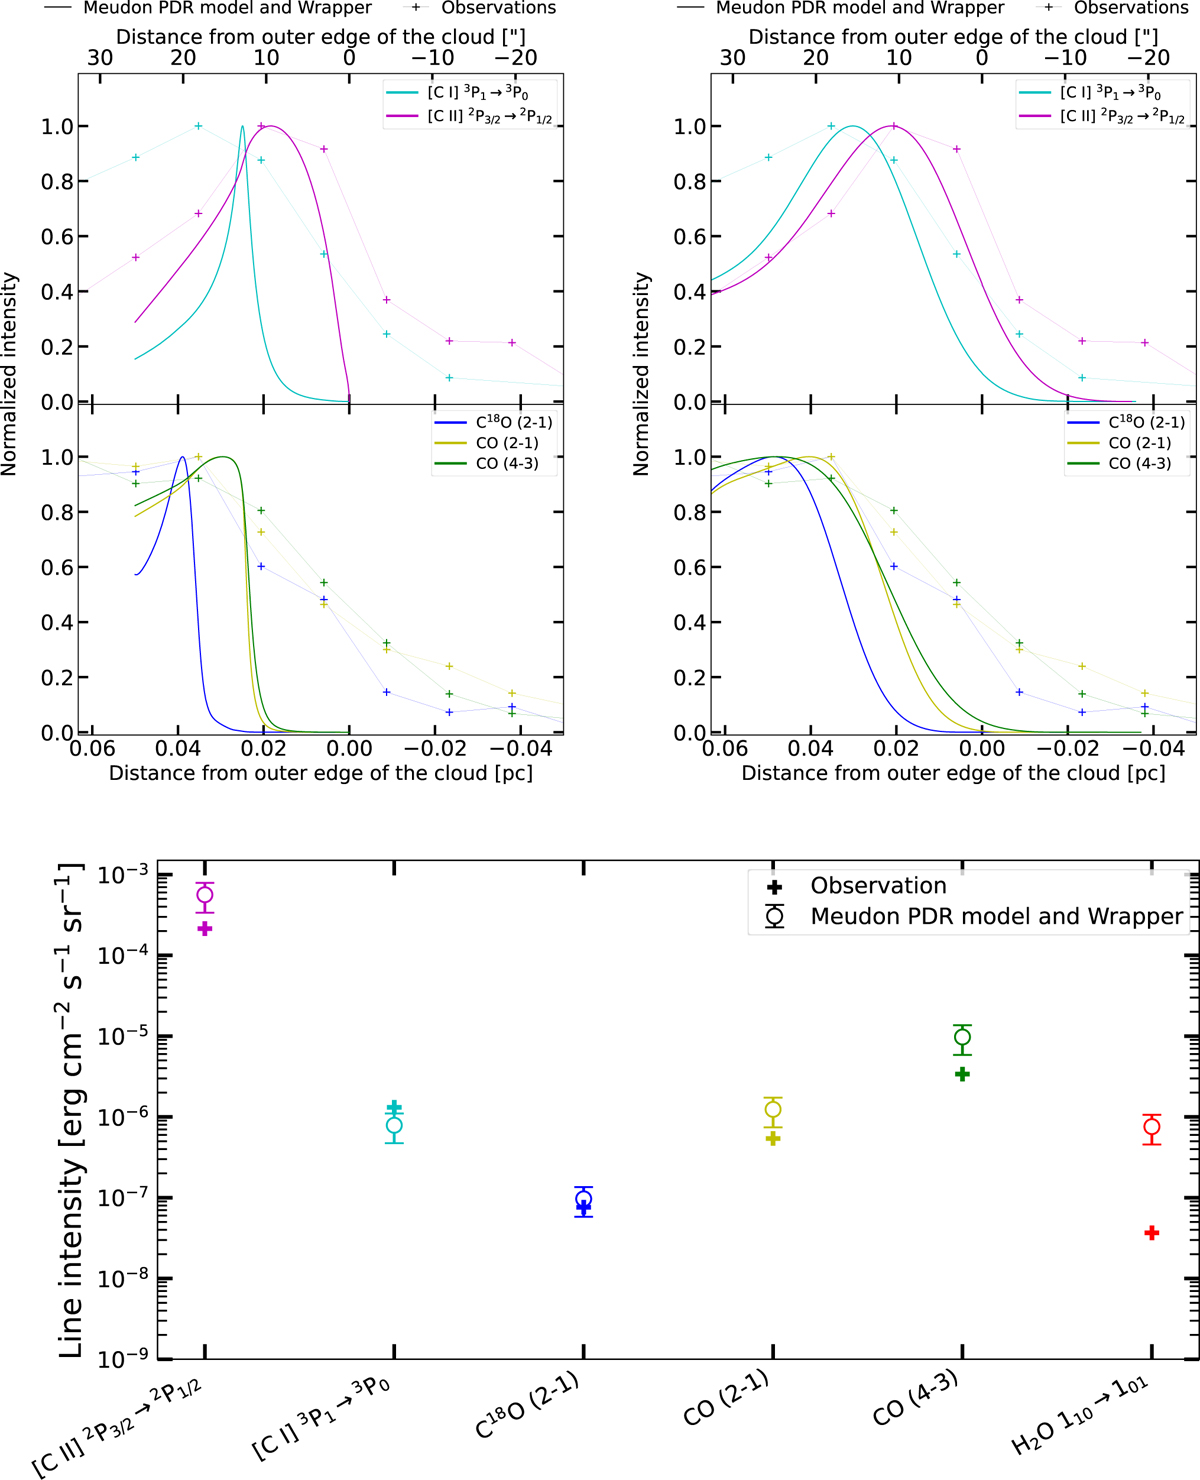
(Top) Spatial profiles of normalized emission line intensities observed in the Horsehead nebula, compared with predictions from a Meudon PDR model with Pth = 4 × 10⁶ K cm−3 and G0 = 100, wrapped in a locally spherical cloud with a curvature radius RC = 0.05 pc. These conditions correspond to commonly adopted literature values. The left panels show the raw profiles from the wrapping procedure, while the right panels present the same profiles convolved to the native angular resolution of each tracer. In those figures, the radiation field comes from the right. (Bottom) Observed maximum intensities of various tracers (colored crosses) compared to model predictions (circles with error bars). All tracers are well reproduced, except for H2O, where the model overestimates the observed maximum intensity by an order of magnitude.
Current usage metrics show cumulative count of Article Views (full-text article views including HTML views, PDF and ePub downloads, according to the available data) and Abstracts Views on Vision4Press platform.
Data correspond to usage on the plateform after 2015. The current usage metrics is available 48-96 hours after online publication and is updated daily on week days.
Initial download of the metrics may take a while.