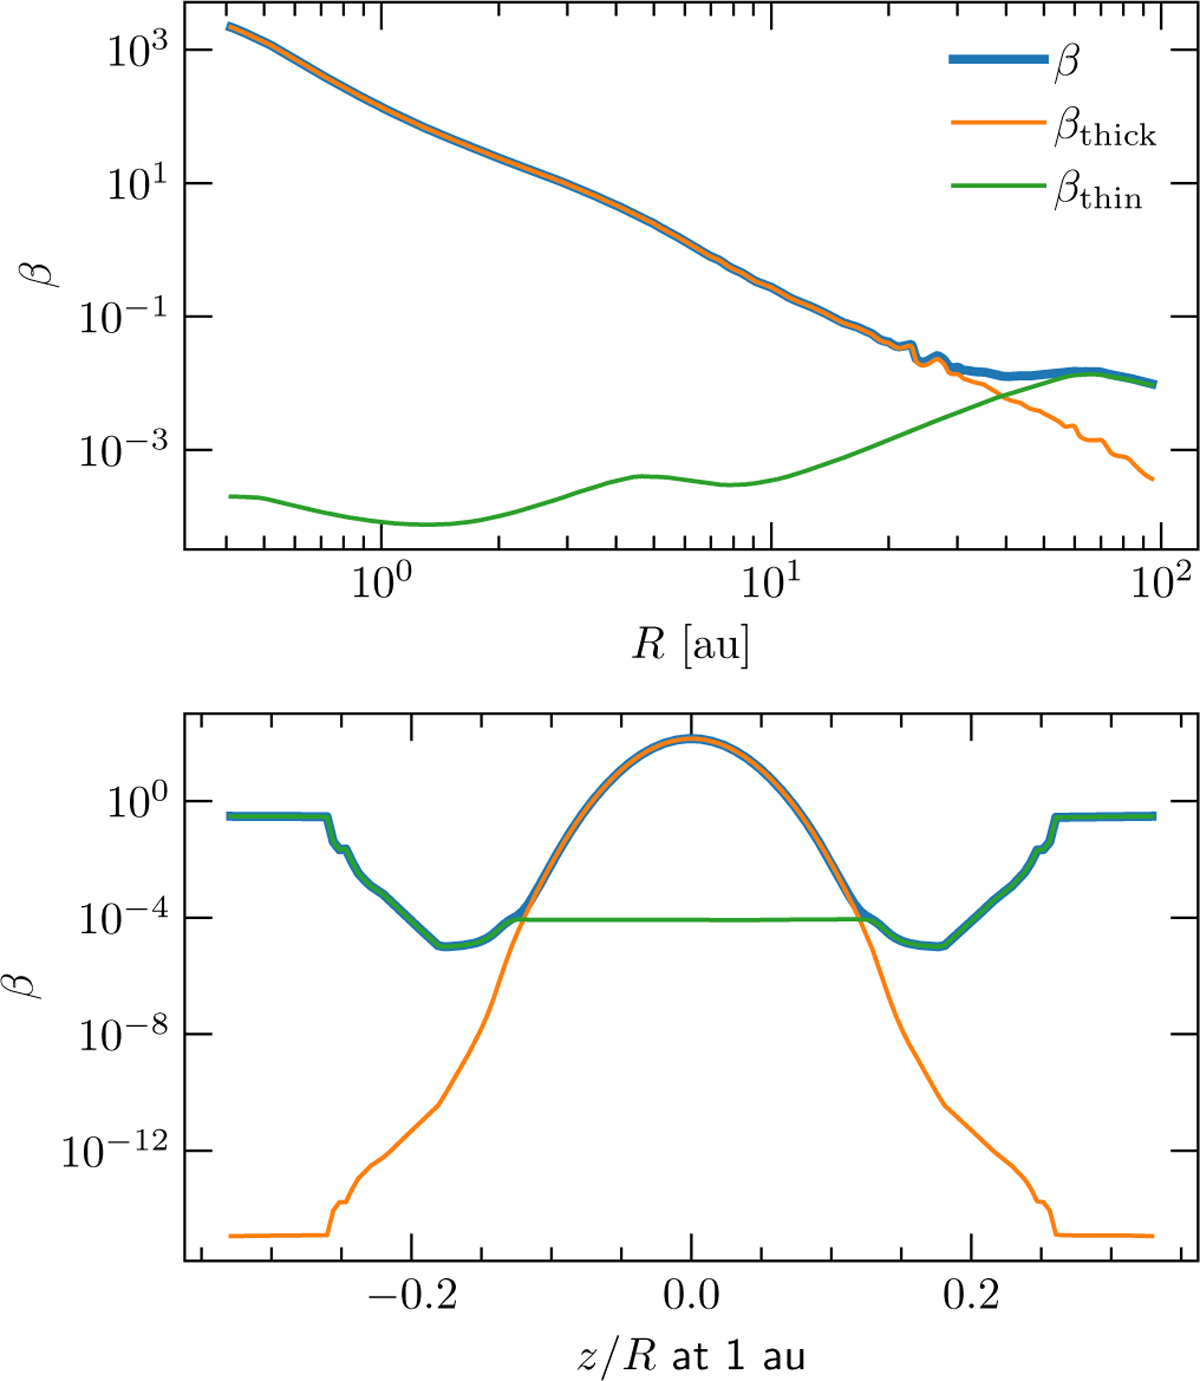
Fig. C.1
Download original image
Top: Radial profile of the cooling timescale β for the disk. The regions of the disk where we find starlight-driven shadows lie in the intermediate cooling timescale regime (1–30 au). Bottom: Vertical profile of the cooling timescale β at R = 1 au. We see that for most of the disk (except for the atmosphere, and outermost regions), optically thick cooling is more dominant.
Current usage metrics show cumulative count of Article Views (full-text article views including HTML views, PDF and ePub downloads, according to the available data) and Abstracts Views on Vision4Press platform.
Data correspond to usage on the plateform after 2015. The current usage metrics is available 48-96 hours after online publication and is updated daily on week days.
Initial download of the metrics may take a while.