Fig. 2
Download original image
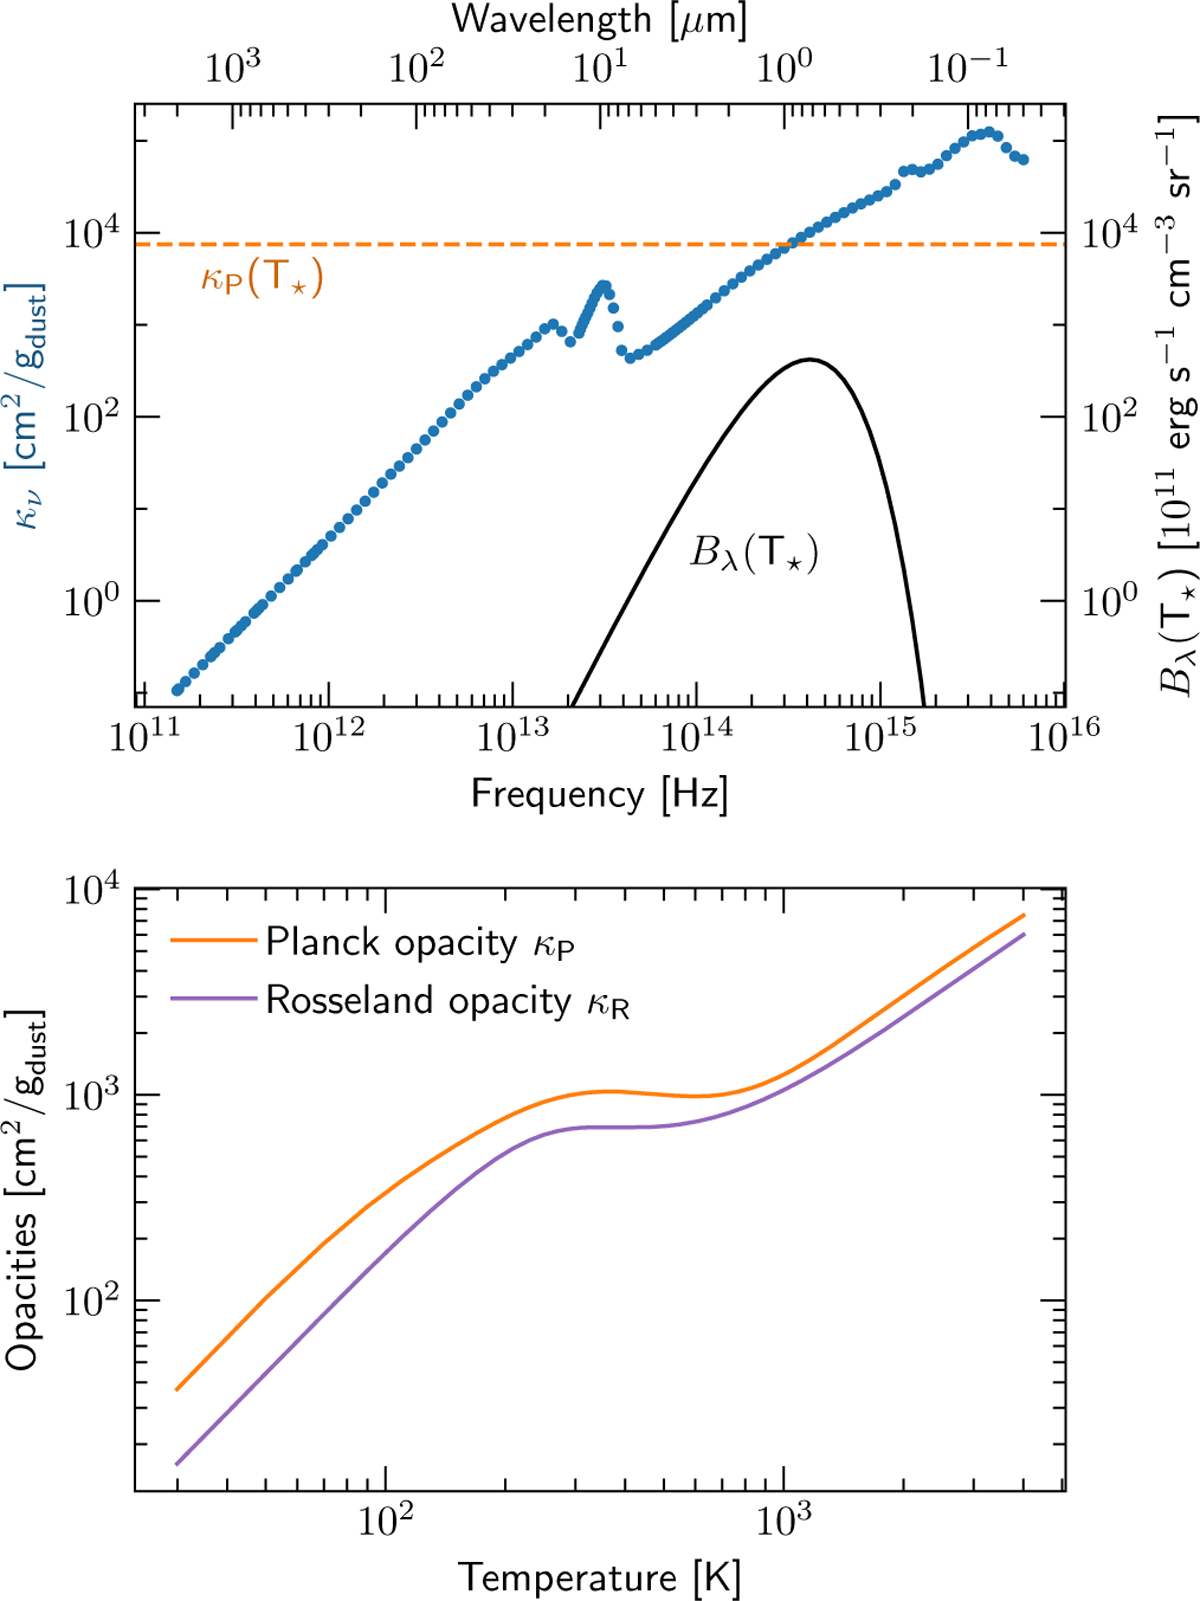
Top panel: frequency-dependent dust absorption opacities (per gram of dust, gdust) from tabulated values (Krieger & Wolf 2020, 2022). The blue points denote 132 frequencies logarithmically sampled in the range ν ∈ [1.5 × 10¹¹, 6 × 10¹⁵] Hz for the computation of irradiation flux in our models. The black line indicates the blackbody function, and the orange line shows the Planck opacity for T⋆ = 4000 K (figure similar to Kuiper et al. 2010). Bottom panel: temperature-dependent Planck and Rosseland mean opacities for the radiation transfer. The local maximum (≈ 250 K) and the subsequent dip in the mean opacities is due to the 10 μm silicate feature.
Current usage metrics show cumulative count of Article Views (full-text article views including HTML views, PDF and ePub downloads, according to the available data) and Abstracts Views on Vision4Press platform.
Data correspond to usage on the plateform after 2015. The current usage metrics is available 48-96 hours after online publication and is updated daily on week days.
Initial download of the metrics may take a while.