Fig. 3
Download original image
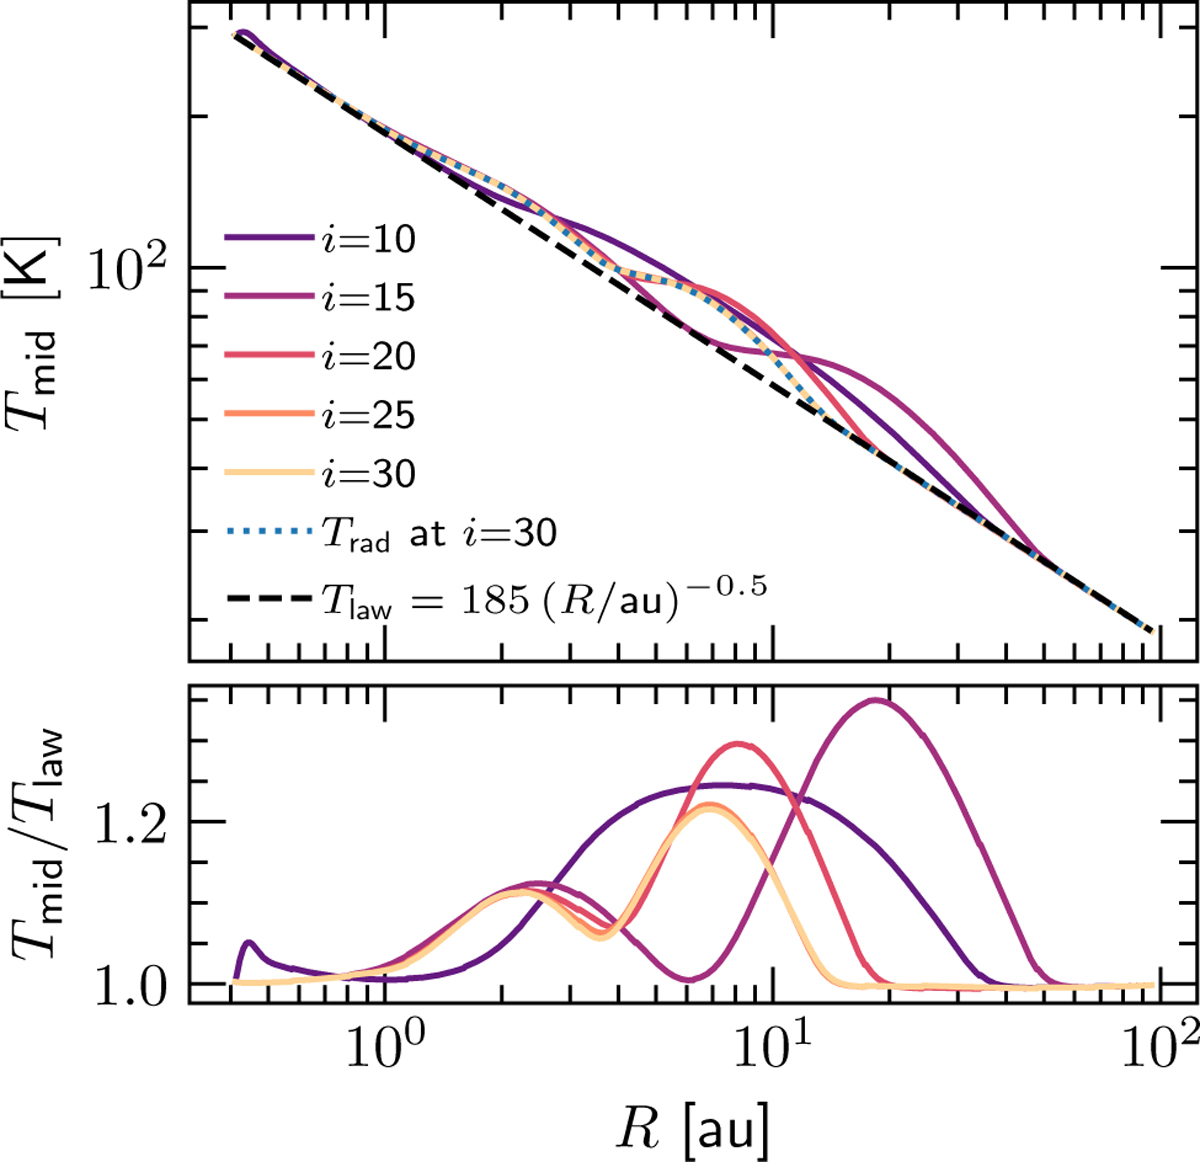
Top: time evolution of the temperature profile at the disk midplane for iterations i = [10, 15, 20, 25, 30]. The profiles indicate that thermal waves form and travel inward with time. There are two bump and shadow pairs at the end of the hydrostatic run for model MFID. The dotted blue line is the radiation temperature at i = 30 and the dashed black line indicates the background power law fit for the midplane Tlaw = 185 (R/au)−0.5. Bottom: deviation of the temperature profile from the background power law.
Current usage metrics show cumulative count of Article Views (full-text article views including HTML views, PDF and ePub downloads, according to the available data) and Abstracts Views on Vision4Press platform.
Data correspond to usage on the plateform after 2015. The current usage metrics is available 48-96 hours after online publication and is updated daily on week days.
Initial download of the metrics may take a while.