Fig. 4
Download original image
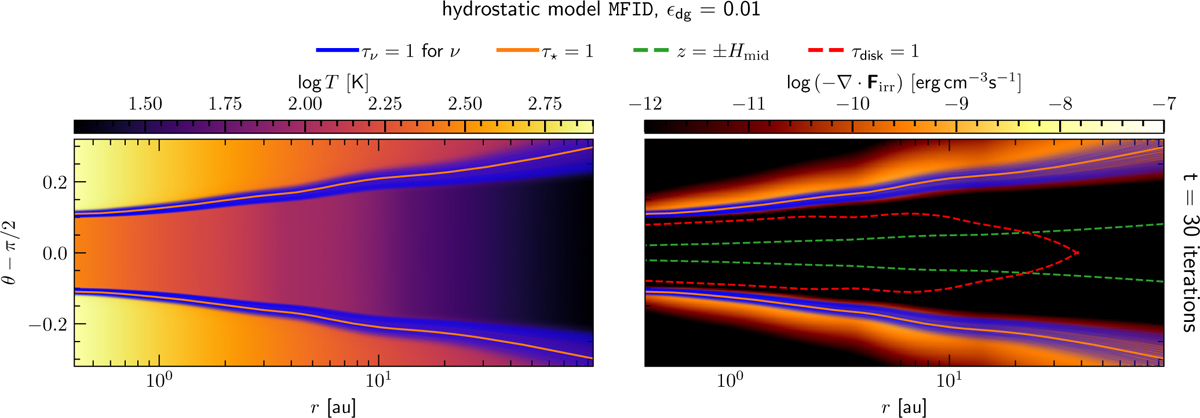
2D profiles of temperature and the irradiation heating term for the hydrostatic model at i = 30 iterations. The orange line refers to the τ⋆ = 1 profile for the stellar radiation using the Planck mean opacity. Blue lines refer to τν = 1 profiles for for different frequencies ν (same as in Fig. 2), with the line opacity weighted by Bν at that frequency. (see also Fig. 7 in Melon Fuksman & Klahr 2022). The red line indicates the τdisk = 1 profile for the disk’s radiation using κP(T). The green lines indicate the midplane gas scale height of the disk.
Current usage metrics show cumulative count of Article Views (full-text article views including HTML views, PDF and ePub downloads, according to the available data) and Abstracts Views on Vision4Press platform.
Data correspond to usage on the plateform after 2015. The current usage metrics is available 48-96 hours after online publication and is updated daily on week days.
Initial download of the metrics may take a while.