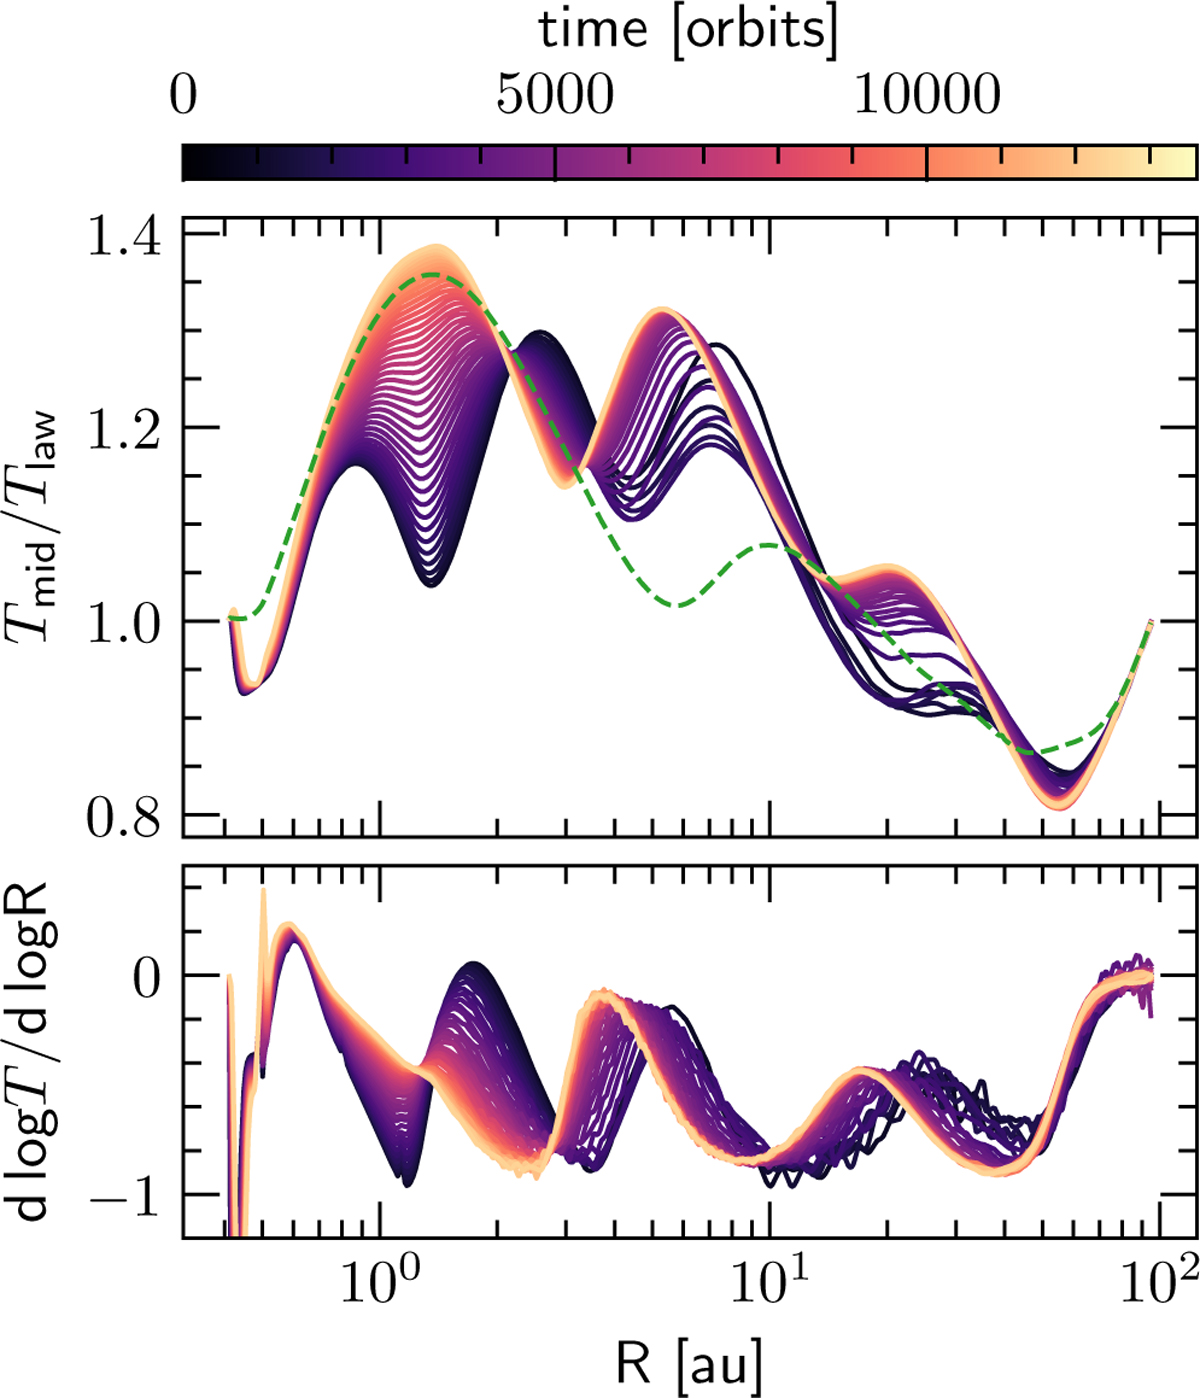
Fig. 9
Download original image
Top: long-term time evolution of the midplane temperature deviation from the background power law for the dynamical model MSIG2000. After about t = 700 orbits, we see that the first and the second bump merge together. We can also spot an additional bump at ≈20 au. The dashed green line corresponds to the final state of the MFID model in Fig. 6, for comparison. Bottom: the evolution of the radial temperature gradient in time similar to Fig. 6. Here, we see that the innermost bump is a local maximum, producing a temperature gradient inversion, while the other two shadows produce slope changes in the profile.
Current usage metrics show cumulative count of Article Views (full-text article views including HTML views, PDF and ePub downloads, according to the available data) and Abstracts Views on Vision4Press platform.
Data correspond to usage on the plateform after 2015. The current usage metrics is available 48-96 hours after online publication and is updated daily on week days.
Initial download of the metrics may take a while.