Fig. 1
Download original image
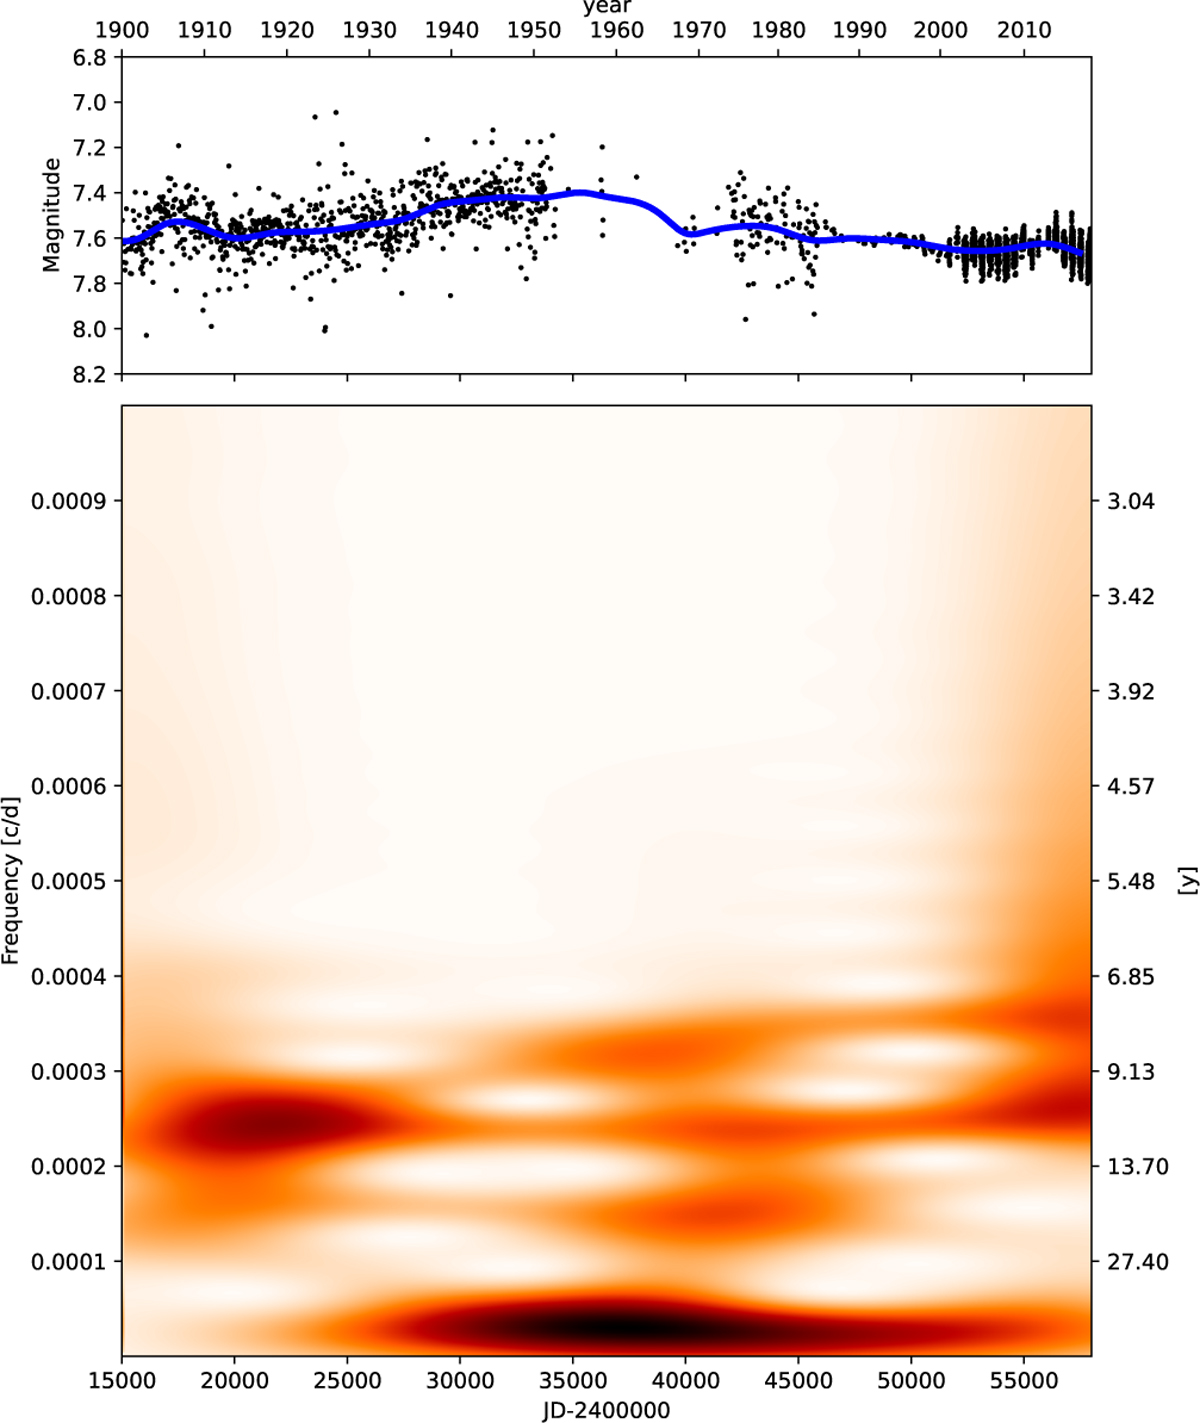
Short-term Fourier transform of the dataset used in Sect. 3.1. A 10.7-12.1-year-long cycle is seen throughout the whole plot, and in the more recent half of the light curve, a 7.3-8.2-year-long period also appears. Features longer than 27 years are suppressed on the plot to one-third of the power. The peak in this range originates from the length of the available data and the gap between 1960 and 1970.
Current usage metrics show cumulative count of Article Views (full-text article views including HTML views, PDF and ePub downloads, according to the available data) and Abstracts Views on Vision4Press platform.
Data correspond to usage on the plateform after 2015. The current usage metrics is available 48-96 hours after online publication and is updated daily on week days.
Initial download of the metrics may take a while.