Open Access
Fig. B.3
Download original image
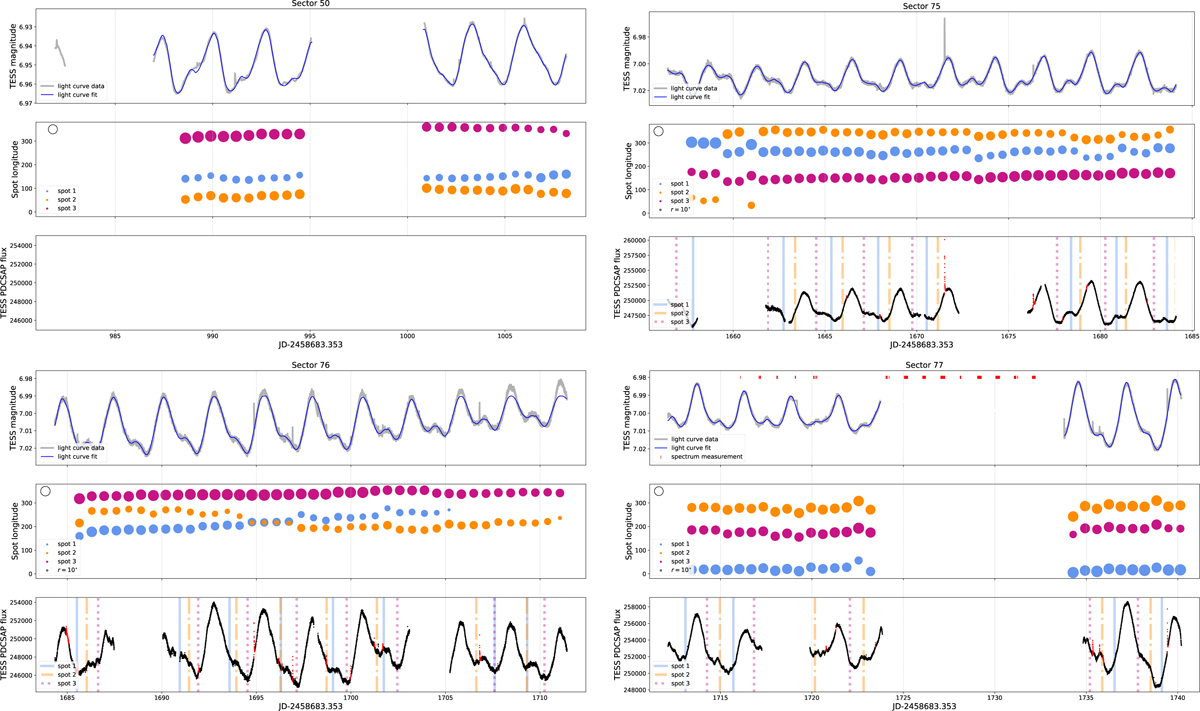
Same as Fig. 2 but for TESS sectors S75, S76, and S77. In the plot corresponding to Sector 77, the top panel shows the time of the spectrum measurements marked with red. For Sector 50 no TESS PDCSAP flux is available.
Current usage metrics show cumulative count of Article Views (full-text article views including HTML views, PDF and ePub downloads, according to the available data) and Abstracts Views on Vision4Press platform.
Data correspond to usage on the plateform after 2015. The current usage metrics is available 48-96 hours after online publication and is updated daily on week days.
Initial download of the metrics may take a while.