Fig. 3
Download original image
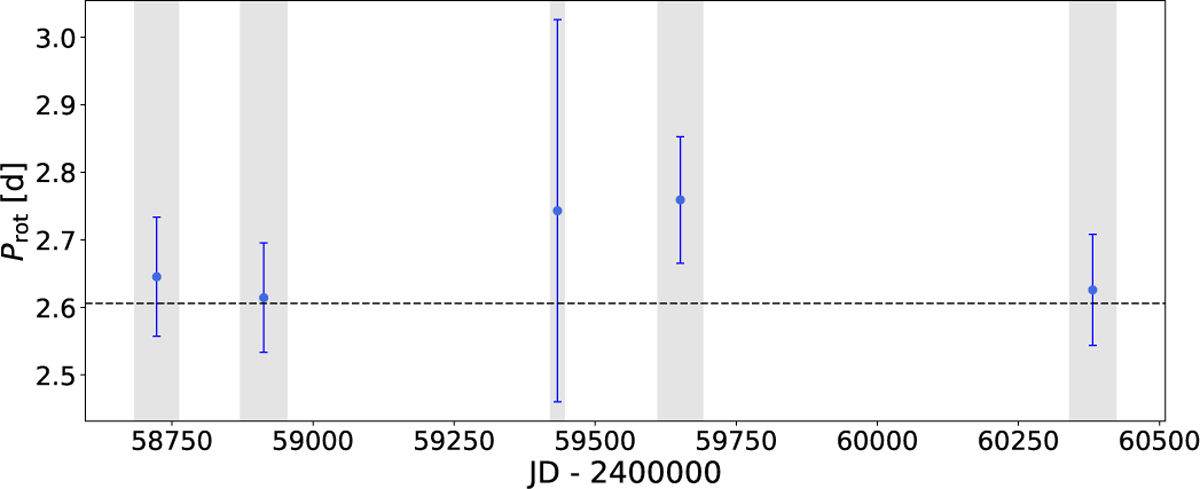
Rotational periods of EK Dra (blue dots) and their estimated error bars in consecutive TESS observation windows (adjacent sectors are considered continuous). The gray areas from left to right are sectors S14-16, S21-23, S41, S48-50, and S75-77. The horizontal dashed line marks the rotation period value we adopted for the Doppler imaging.
Current usage metrics show cumulative count of Article Views (full-text article views including HTML views, PDF and ePub downloads, according to the available data) and Abstracts Views on Vision4Press platform.
Data correspond to usage on the plateform after 2015. The current usage metrics is available 48-96 hours after online publication and is updated daily on week days.
Initial download of the metrics may take a while.