Open Access
Fig. 4
Download original image
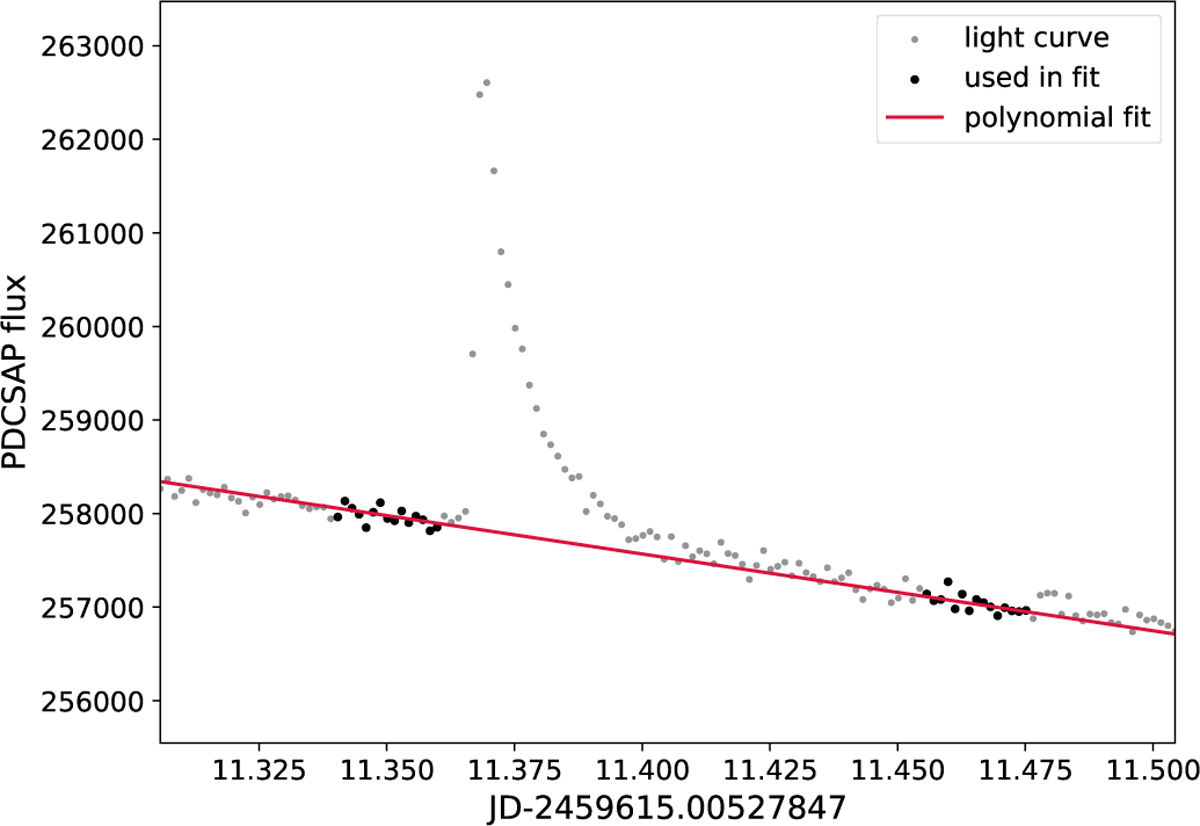
Example of the polynomial fitting of the flare baseline. The data are marked in gray, the black points were used for the fit, and red shows the baseline fit. The flare is from Sector 48.
Current usage metrics show cumulative count of Article Views (full-text article views including HTML views, PDF and ePub downloads, according to the available data) and Abstracts Views on Vision4Press platform.
Data correspond to usage on the plateform after 2015. The current usage metrics is available 48-96 hours after online publication and is updated daily on week days.
Initial download of the metrics may take a while.