Fig. 8
Download original image
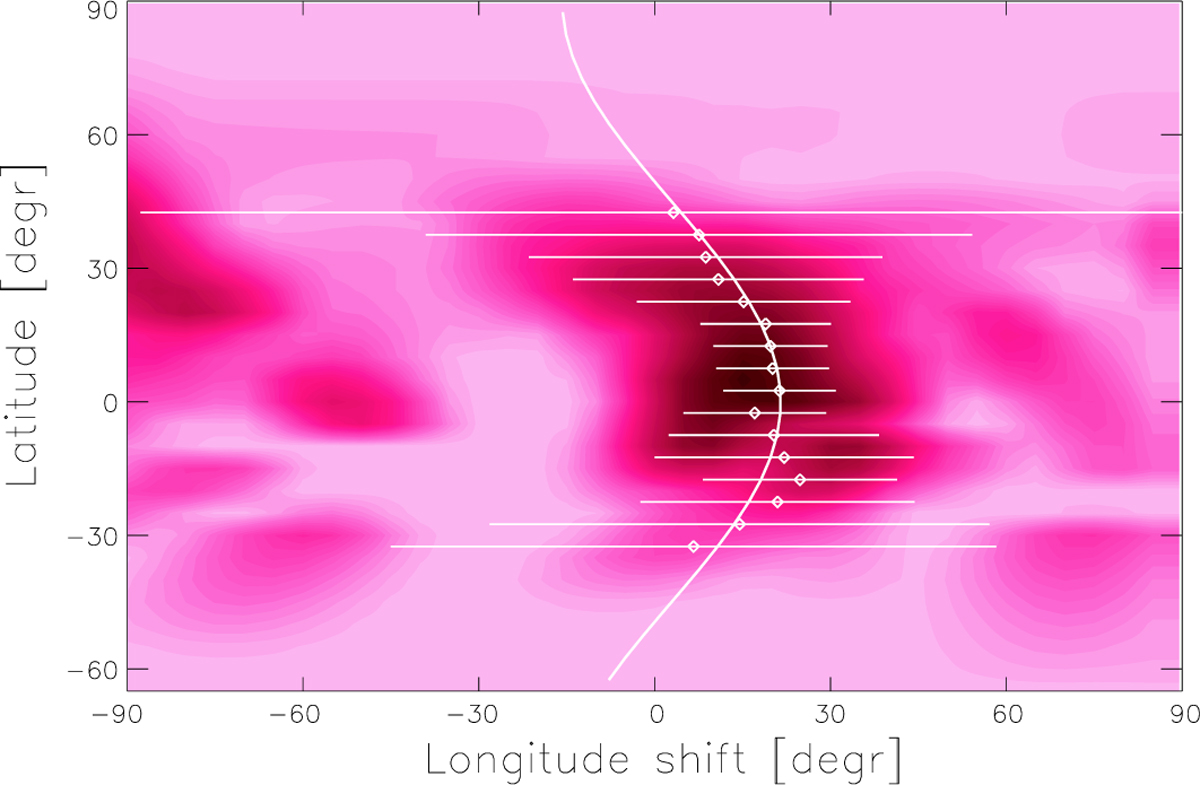
Average cross-correlation function map for the consecutive Doppler reconstructions. The white circles mark the cross correlation peaks, and the continuous white line shows the quadratic differential rotational law we fit. The best-fit surface shear corresponds to αDR = 0.030 ± 0.008 shear coefficient and indicates a solar-type differential rotation.
Current usage metrics show cumulative count of Article Views (full-text article views including HTML views, PDF and ePub downloads, according to the available data) and Abstracts Views on Vision4Press platform.
Data correspond to usage on the plateform after 2015. The current usage metrics is available 48-96 hours after online publication and is updated daily on week days.
Initial download of the metrics may take a while.