Fig. 5.
Download original image
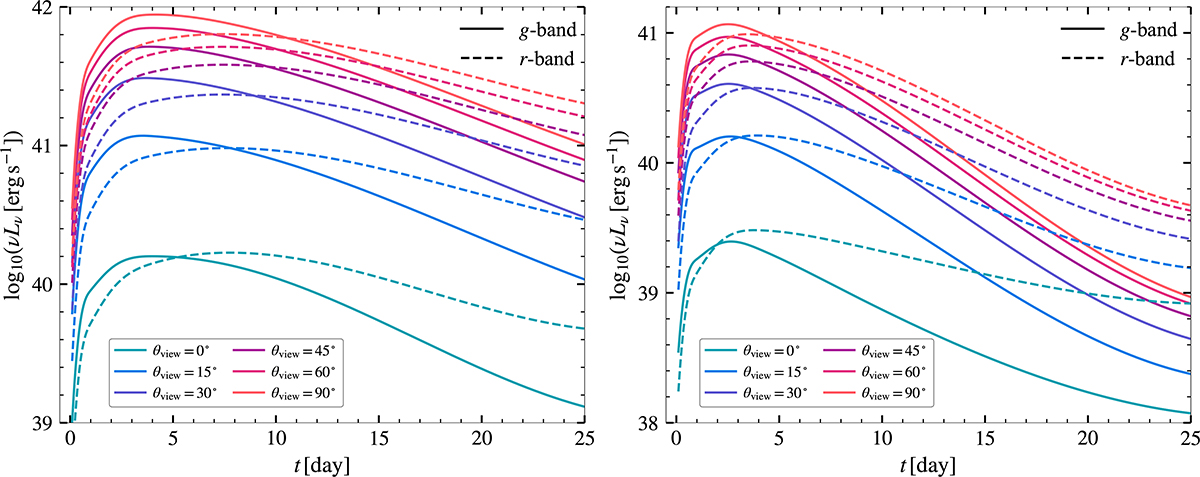
Optical luminosity light curve of WD–NS mSNe. The left panel shows our fiducial model, assuming an ejecta mass of Mej = 0.3 M⊙ and a 56Ni mass of MNi = 0.01 M⊙. The right panel presents the WD–NS mSNe model in which both the ejecta and 56Ni masses are reduced by an order of magnitude, adopting Mej = 0.03 M⊙ and MNi = 0.001 M⊙. Different colors indicate different viewing angles at θview = 0°, 15°, 30°, 45°, 60°, and 90°. Solid and dashed lines correspond to the g- and r-band luminosities, respectively.
Current usage metrics show cumulative count of Article Views (full-text article views including HTML views, PDF and ePub downloads, according to the available data) and Abstracts Views on Vision4Press platform.
Data correspond to usage on the plateform after 2015. The current usage metrics is available 48-96 hours after online publication and is updated daily on week days.
Initial download of the metrics may take a while.