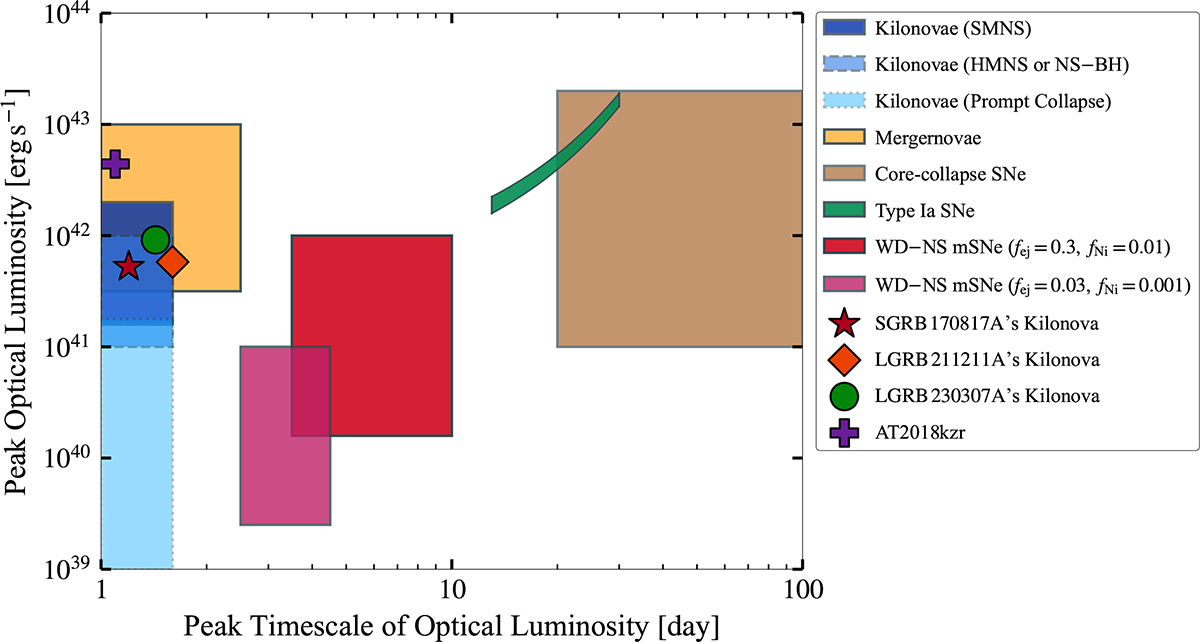
Fig. 6.
Download original image
Comparisons of the peak timescale and peak optical luminosity for various optical transients with t ≳ 1 d. The three blue-shaded regions, from dark to light, correspond to kilonova models associated with SMNS, HMNS or NS–BH, and prompt-collapse scenarios, respectively (Kawaguchi et al. 2020b). The yellow-shaded region indicates the parameter space for central-engine-powered kilonovae (i.e., the so-called “mergernova” model; Yu et al. 2013; Ai et al. 2025). The brown and green shaded regions denote core-collapse and type Ia SNe, respectively (Kasliwal 2012; Cenko 2017; Inserra 2019). The red and pink shaded regions represent the WD–NS mSNe explored in this work, corresponding to models with fiducial and reduced values of fej and fNi, respectively. For reference, we also indicate three well-known kilonova events associated with SGRB 170817A (red star; Villar et al. 2017), LGRB 211211A (orange diamond; Yang et al. 2022), and LGRB 230307A (green circle Levan et al. 2024), as well as the candidate WD–NS merger event AT2018kzr (purple cross; McBrien et al. 2019).
Current usage metrics show cumulative count of Article Views (full-text article views including HTML views, PDF and ePub downloads, according to the available data) and Abstracts Views on Vision4Press platform.
Data correspond to usage on the plateform after 2015. The current usage metrics is available 48-96 hours after online publication and is updated daily on week days.
Initial download of the metrics may take a while.