Fig. 1
Download original image
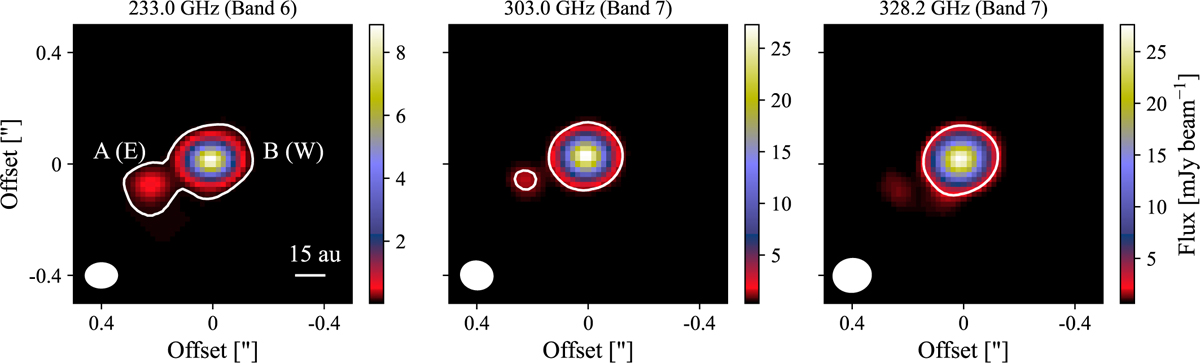
Continuum emission of IRS 44 above 3σ at different frequencies. The white contour represents a flux value of 10σ. The synthesized beam is represented by a filled white ellipse in the lower left corner of each panel. IRS 44 A and B can also be found as IRS 44 E and W in the literature, respectively (e.g., Herczeg et al. 2011).
Current usage metrics show cumulative count of Article Views (full-text article views including HTML views, PDF and ePub downloads, according to the available data) and Abstracts Views on Vision4Press platform.
Data correspond to usage on the plateform after 2015. The current usage metrics is available 48-96 hours after online publication and is updated daily on week days.
Initial download of the metrics may take a while.