Fig. C.1
Download original image
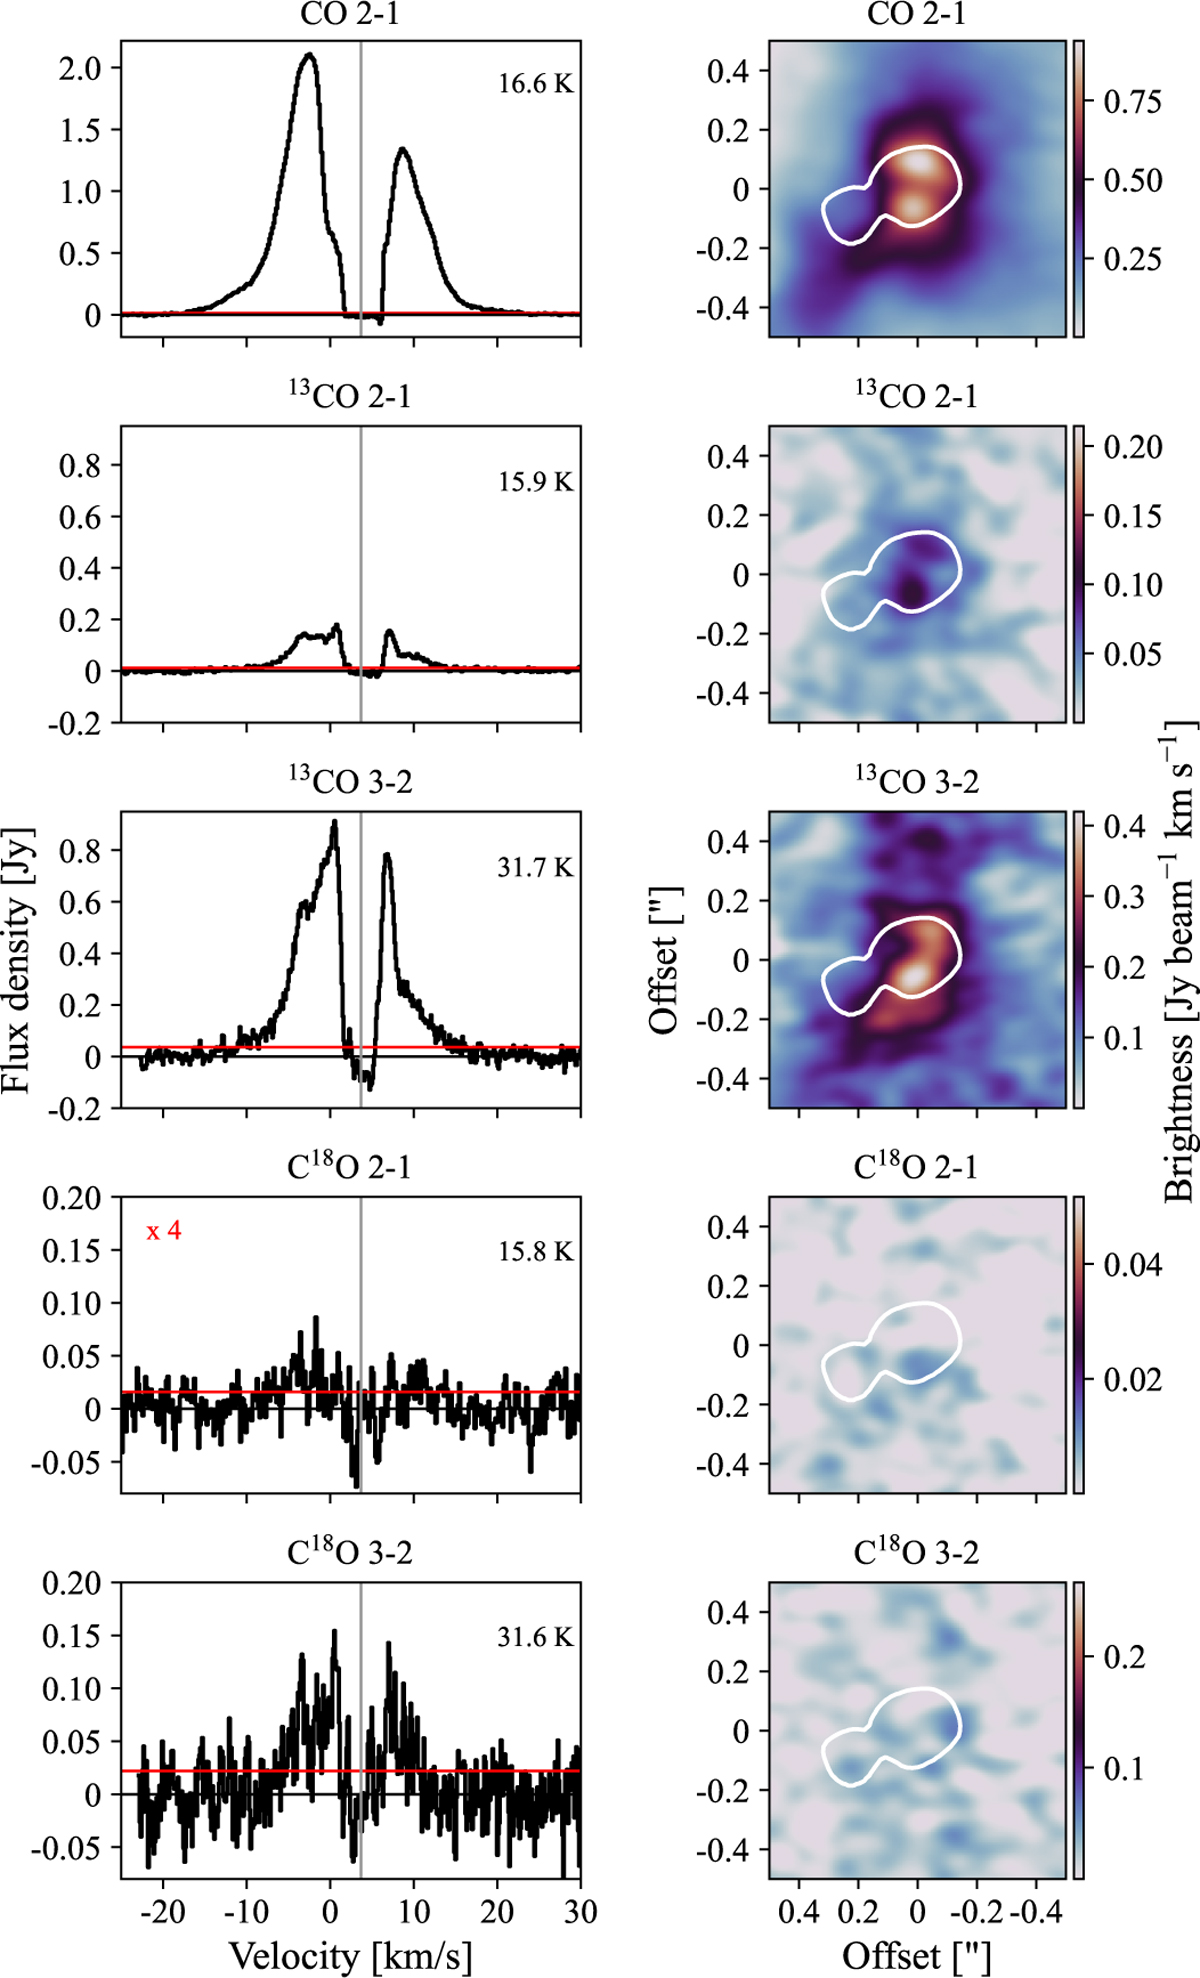
Emission of CO isotopologs. Left: Spectra taken from a region with a radius of ![]() around the brightest component, the upper level energy of each transition is shown in the upper-right corner of each spectrum, and the horizontal red line represents 1σ. The C18O 2–1 spectrum has been multiplied by a factor of 4 for a better comparison. Right: Moment 0 maps integrated from −25 to +25 km s−1, with respect to the systemic velocity (3.7 km s−1). White contours represent the continuum emission at 233 GHz at a 10σ value.
around the brightest component, the upper level energy of each transition is shown in the upper-right corner of each spectrum, and the horizontal red line represents 1σ. The C18O 2–1 spectrum has been multiplied by a factor of 4 for a better comparison. Right: Moment 0 maps integrated from −25 to +25 km s−1, with respect to the systemic velocity (3.7 km s−1). White contours represent the continuum emission at 233 GHz at a 10σ value.
Current usage metrics show cumulative count of Article Views (full-text article views including HTML views, PDF and ePub downloads, according to the available data) and Abstracts Views on Vision4Press platform.
Data correspond to usage on the plateform after 2015. The current usage metrics is available 48-96 hours after online publication and is updated daily on week days.
Initial download of the metrics may take a while.