Open Access
Fig. 6
Download original image
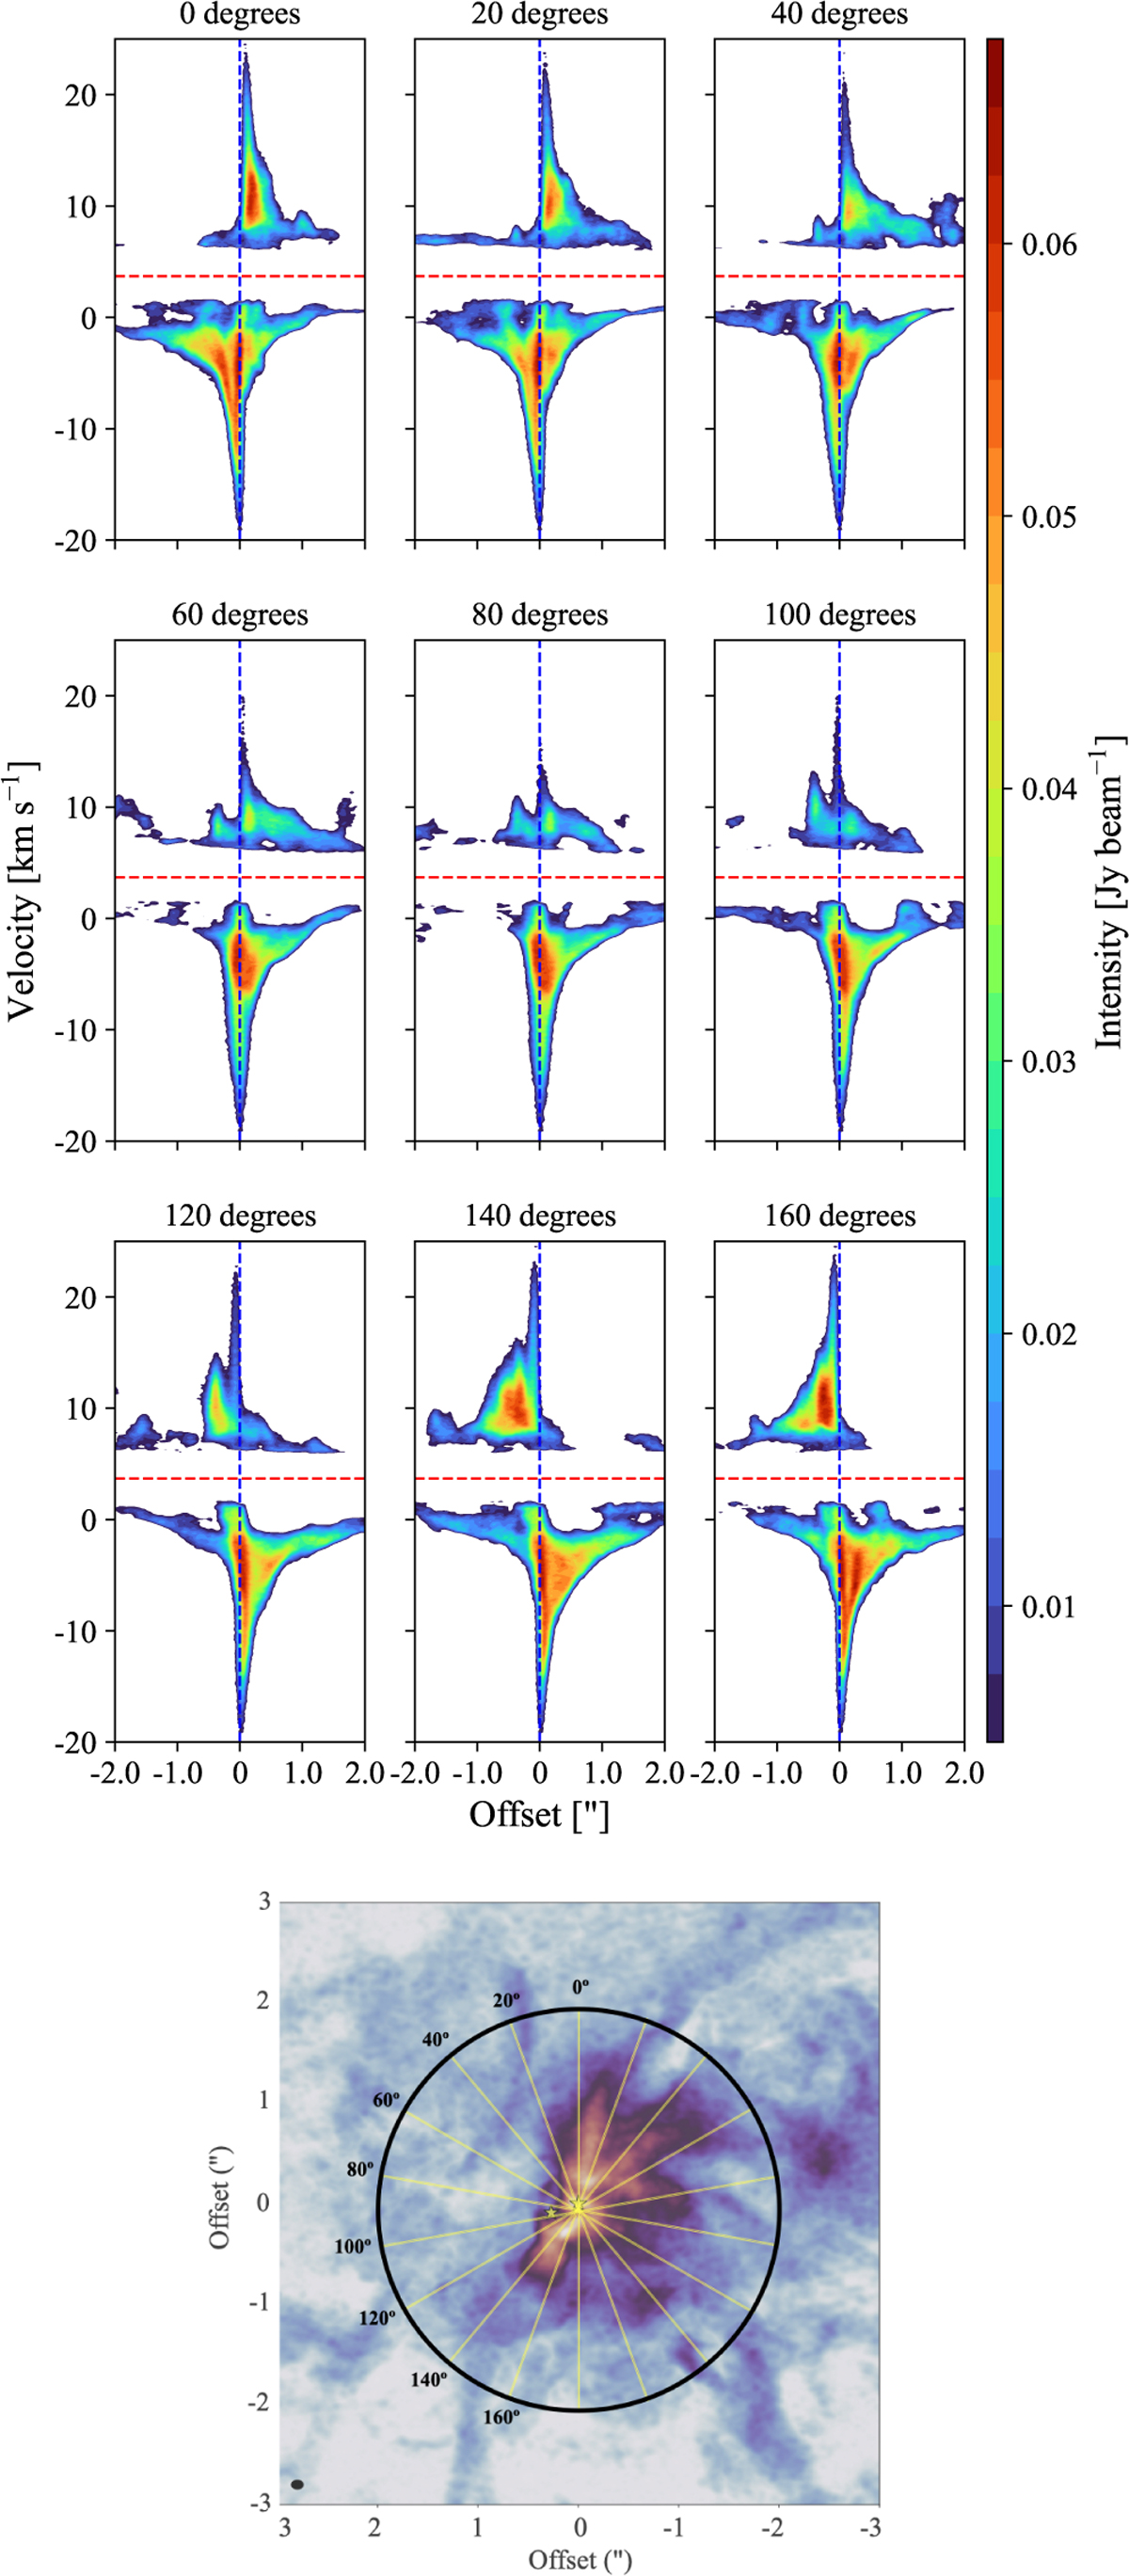
Position–velocity (PV) diagrams for CO 2–1 (upper panels) above 3σ. The horizontal dashed red line represents the systemic velocity of 3.7 km s−1, while the vertical dashed blue line corresponds to the central position of source B. The different PAs (lower panel) are indicated by yellow lines over the CO 2–1 moment 8 map.
Current usage metrics show cumulative count of Article Views (full-text article views including HTML views, PDF and ePub downloads, according to the available data) and Abstracts Views on Vision4Press platform.
Data correspond to usage on the plateform after 2015. The current usage metrics is available 48-96 hours after online publication and is updated daily on week days.
Initial download of the metrics may take a while.