Fig. 7
Download original image
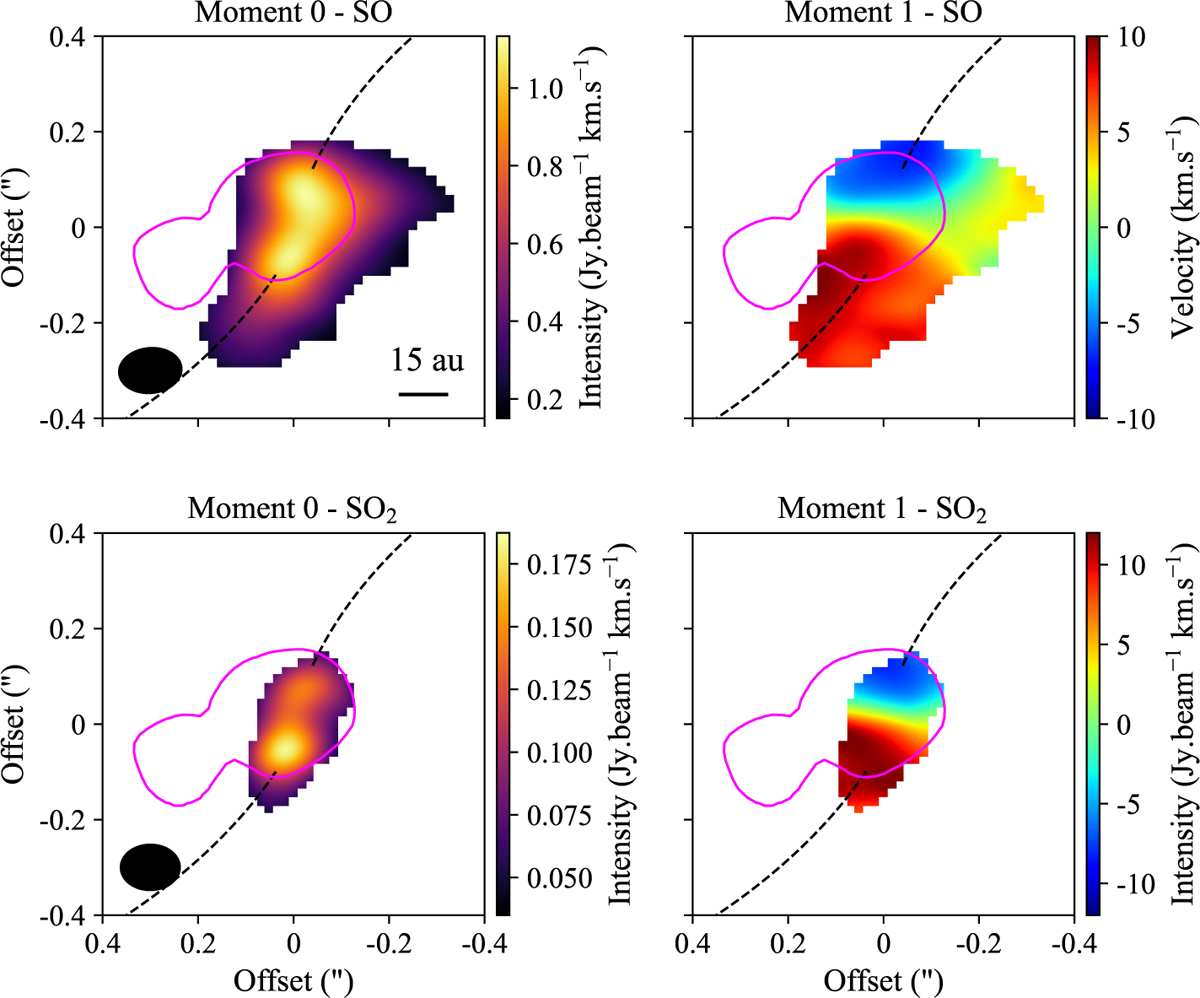
SO and SO2 emission. Upper panels: moment 0 and 1 maps for SO 78–67 above 5σ. Lower panels: moment 0 and 1 maps for SO2 222,20–221,21 above 5σ. The magenta contour represents the continuum emission at 233 GHz at a 10σ value and the dashed black curves indicate the direction of the proposed streamers. The synthesized beam is represented by a filled black ellipse in the left panels.
Current usage metrics show cumulative count of Article Views (full-text article views including HTML views, PDF and ePub downloads, according to the available data) and Abstracts Views on Vision4Press platform.
Data correspond to usage on the plateform after 2015. The current usage metrics is available 48-96 hours after online publication and is updated daily on week days.
Initial download of the metrics may take a while.