Fig. 8
Download original image
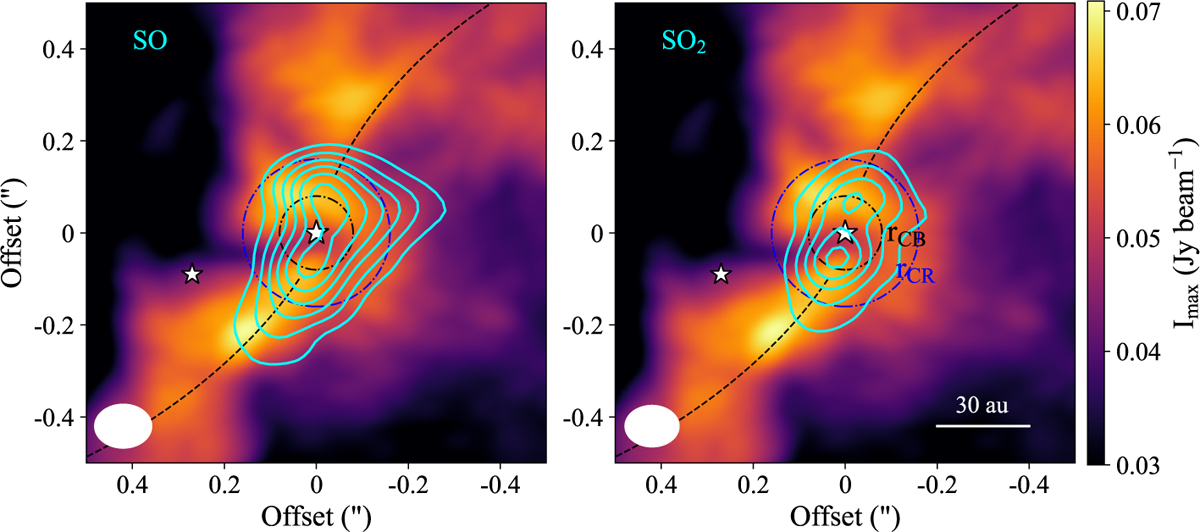
CO (moment 8) emission in colorscale superimposed with SO (left) and SO2 (right) contours from moment 0 maps (in steps of 5σ). The dashed black curves indicate the direction of the proposed streamers. The dashed black and blue circles represent the extent of the centrifugal barrier and centrifugal radius, respectively, from Artur de la Villarmois et al. (2022). The synthesized beam is represented by a filled white ellipse.
Current usage metrics show cumulative count of Article Views (full-text article views including HTML views, PDF and ePub downloads, according to the available data) and Abstracts Views on Vision4Press platform.
Data correspond to usage on the plateform after 2015. The current usage metrics is available 48-96 hours after online publication and is updated daily on week days.
Initial download of the metrics may take a while.