Open Access
Fig. 9
Download original image
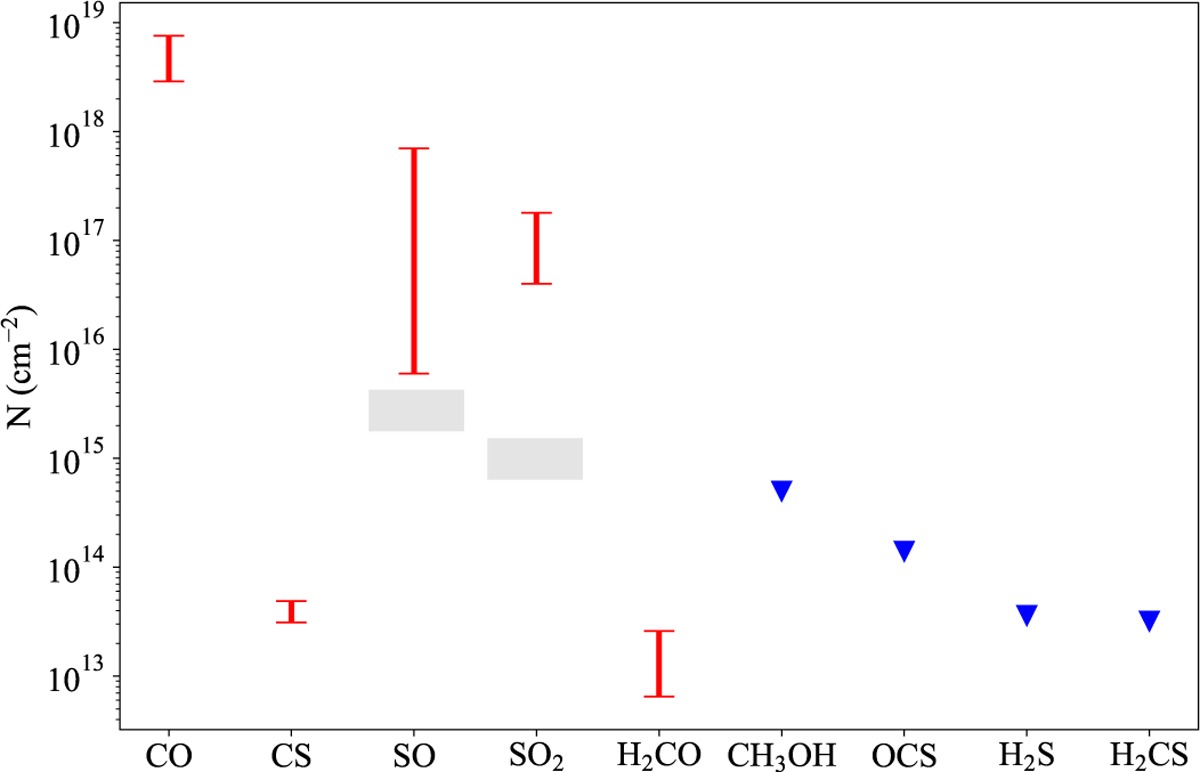
Molecular column densities. Values are taken from Table 4, where red bars represent the estimated ranges and blue triangles indicate upper limits. Horizontal gray bars represent average values (±1σ) from Class I sources in the Perseus star-forming region (Artur de la Villarmois et al. 2023).
Current usage metrics show cumulative count of Article Views (full-text article views including HTML views, PDF and ePub downloads, according to the available data) and Abstracts Views on Vision4Press platform.
Data correspond to usage on the plateform after 2015. The current usage metrics is available 48-96 hours after online publication and is updated daily on week days.
Initial download of the metrics may take a while.