Fig. 3
Download original image
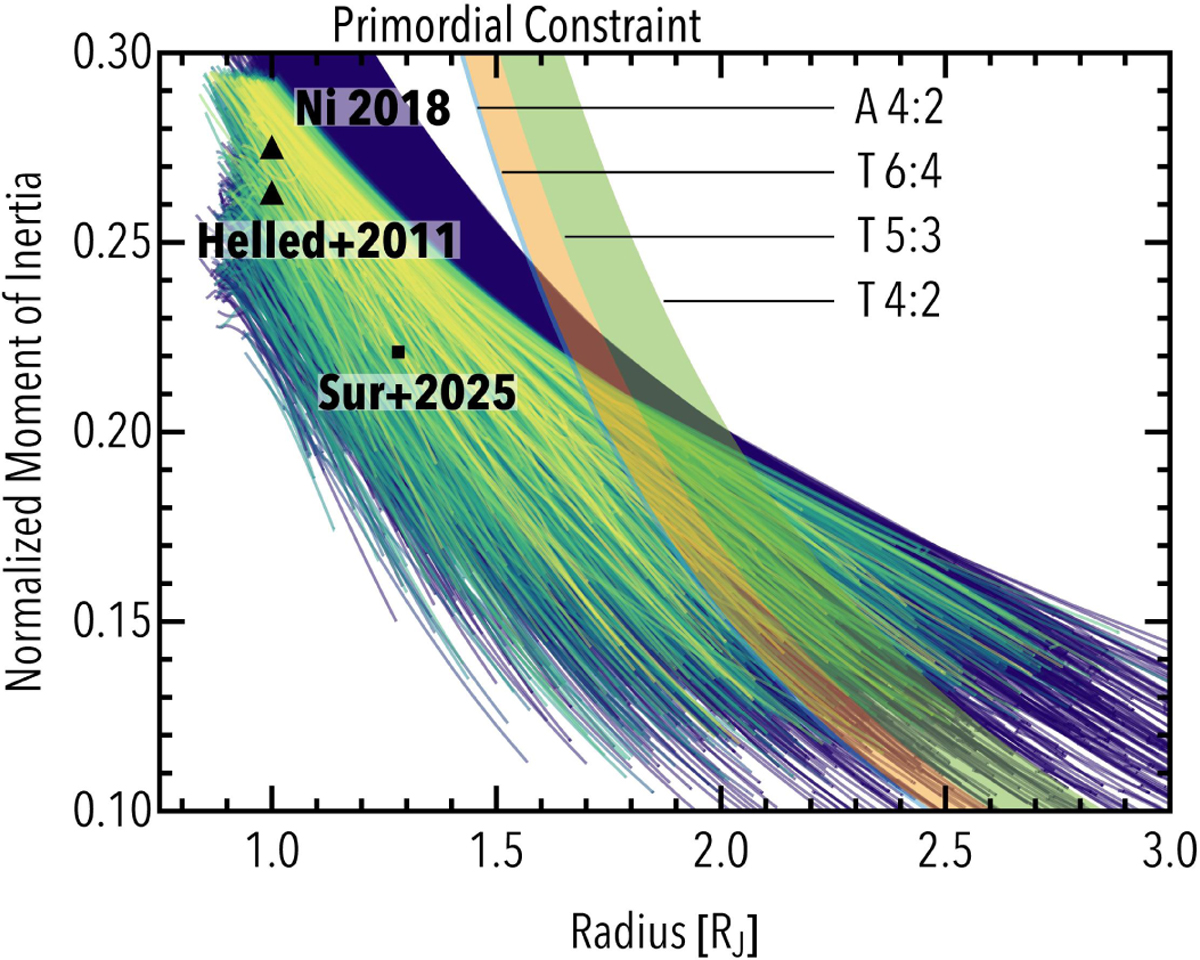
Time evolution of normalized moment of inertia vs. radius for the sample of randomly generated Jupiter models. The line colors are the same as in Fig. 1. The colored regions indicate the primordial constraint of Eq. (1), where the labels indicate the resonance of Io with Amalthea (A) or Thebe (T), respectively. The black triangles mark Jupiter’s present-day radius and NMoI as estimated by Helled et al. (2011) and Ni (2018), respectively. The black square corresponds to the initial model from Sur et al. (2025b).
Current usage metrics show cumulative count of Article Views (full-text article views including HTML views, PDF and ePub downloads, according to the available data) and Abstracts Views on Vision4Press platform.
Data correspond to usage on the plateform after 2015. The current usage metrics is available 48-96 hours after online publication and is updated daily on week days.
Initial download of the metrics may take a while.