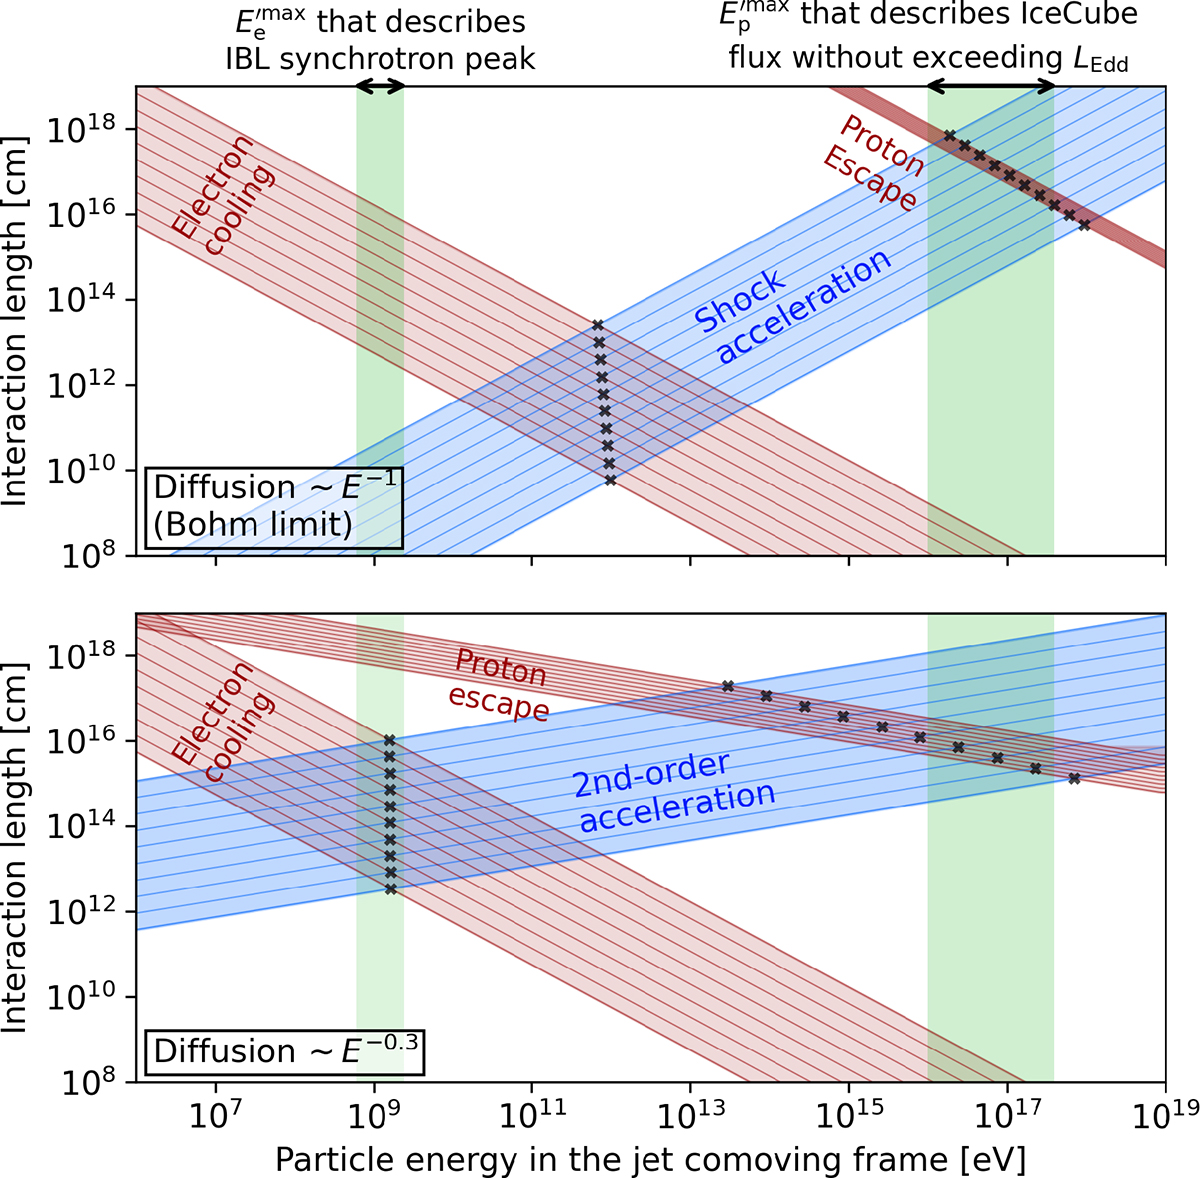
Fig. 1.
Download original image
Two scenarios of diffusion and acceleration. Upper panel: Diffusive shock acceleration with a diffusion coefficient D′E ∼ E′ − 1. Lower panel: Stochastic acceleration with D′E ∼ E′0.3. The timescales are given for the wide range of parameters η, B′, and R′j expected at distances 1017 cm ≲ r ≲ pc, as detailed in the main text. Black crosses show the maximum energy of electrons and protons predicted by the respective scenario. Green bands show the allowed range of E′e and E′p necessary to describe the multimessenger data.
Current usage metrics show cumulative count of Article Views (full-text article views including HTML views, PDF and ePub downloads, according to the available data) and Abstracts Views on Vision4Press platform.
Data correspond to usage on the plateform after 2015. The current usage metrics is available 48-96 hours after online publication and is updated daily on week days.
Initial download of the metrics may take a while.