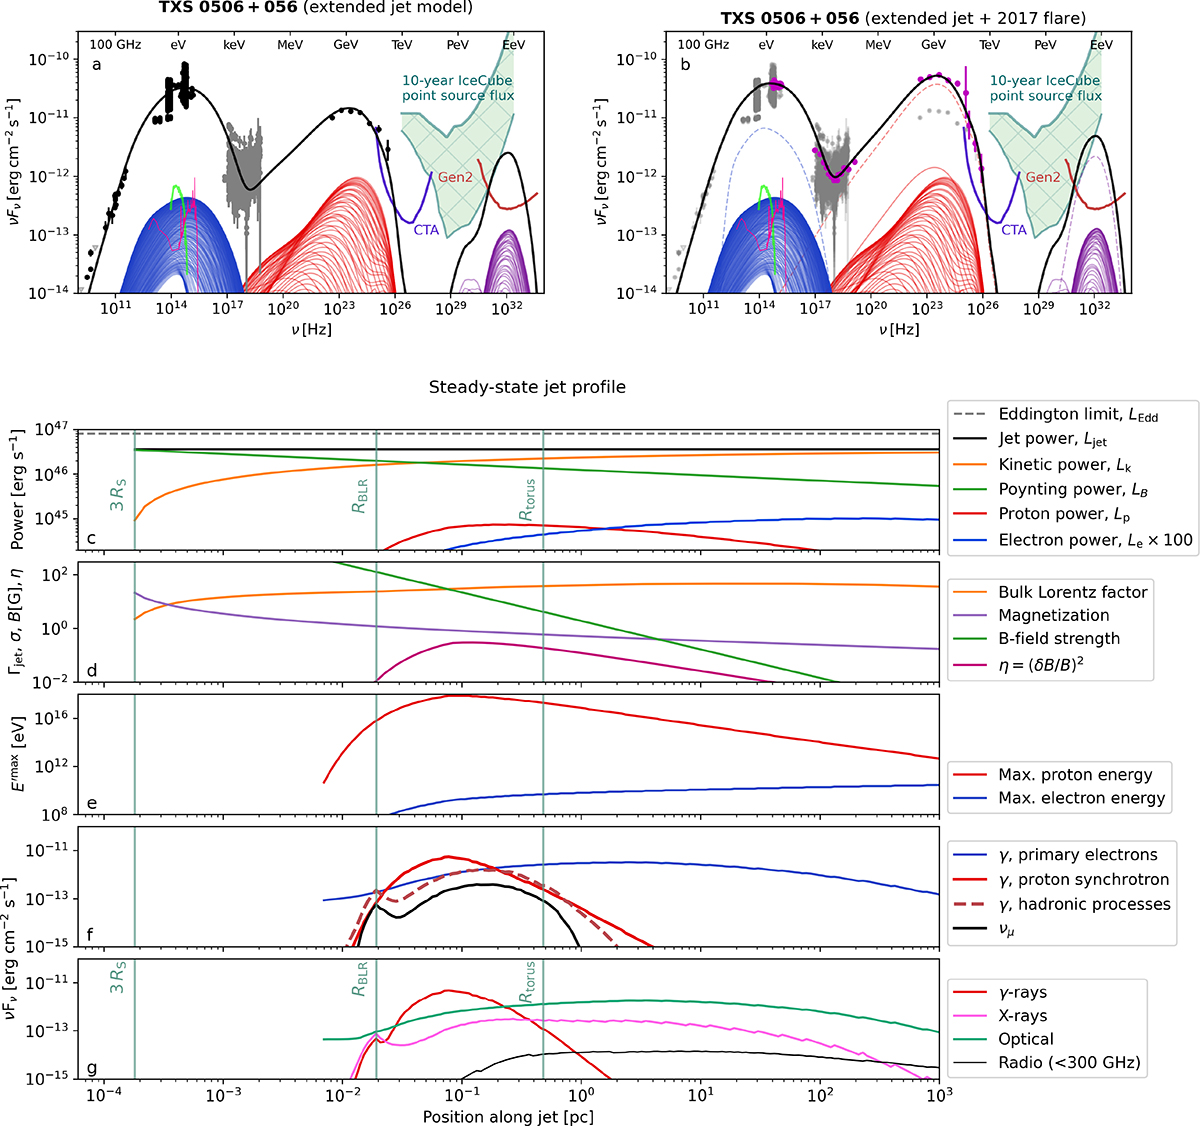
Fig. 2.
Download original image
Extended jet model applied to the IceCube candidate blazar TXS 0506+056, fitted to the average multiwavelength emission (panel a, data taken from Rodrigues et al. 2024b, see references therein) and during the 2017 flaring event (panel b, data in magenta taken from IceCube Collaboration 2018; Keivani et al. 2018). The top panels show the best-fit spectra. The color curves show the photon emission by primary electrons (blue), photon emission by protons (red), and muon neutrino emission (purple) from the successive zones along the jet. The dashed curves in panel b show the emission from the flare zone. The black curves show the total emission. The green band shows the 68% CL limits on the neutrino point source flux from the source (Rodrigues et al. 2024b), and the dark red curve the UHE sensitivity of IceCube-Gen2 (Aartsen et al. 2021). The pink curve shows the BLR and accretion disk continuum emission, and the bright green curve the host galaxy contribution (see Rodrigues et al. 2024b). In panels c–g, we show the evolution along the extended jet of the jet energetics (c), dynamics (d), particle profile (e) and emission (f, g).
Current usage metrics show cumulative count of Article Views (full-text article views including HTML views, PDF and ePub downloads, according to the available data) and Abstracts Views on Vision4Press platform.
Data correspond to usage on the plateform after 2015. The current usage metrics is available 48-96 hours after online publication and is updated daily on week days.
Initial download of the metrics may take a while.