Fig. 4
Download original image
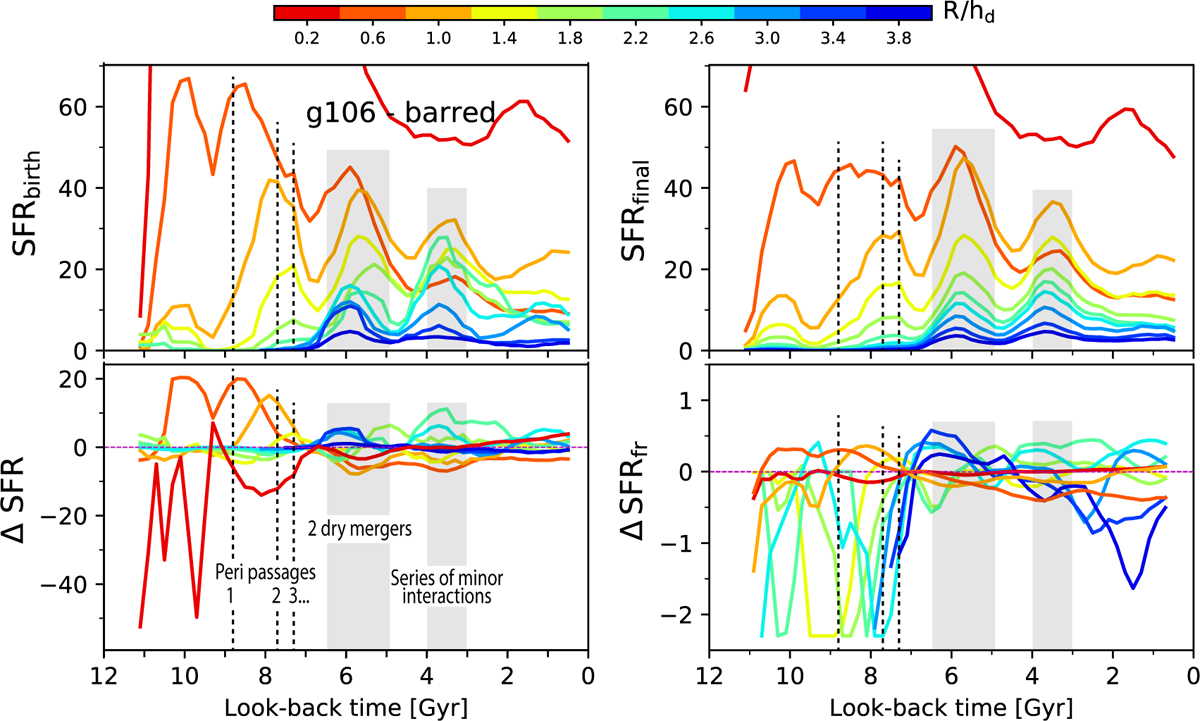
Top: SFR for galaxy simulation g106, computed in bins of birth radius (left) and final radius (right), using the ten radial bins defined in Fig. 3. SFRs are measured in 1 Gyr-wide age bins, spaced by 0.2 Gyr, and have units of M⊙ pc−2 Gyr−1. To select stars formed in the disk, for all plots we apply a vertical cut at birth, |z0| ≤ 0.3hd, where hd is the disk scale length. To improve visibility across bins, the vertical axis is normalized to the second innermost bin. Bottom: absolute difference between the SFH computed from birth and final radii, ∆SFR = SFR(Rbirth) − SFR(Rfinal), shown on the left, and the corresponding fractional difference, ∆SFRfr = ∆SFR/SFR(Rbirth), shown on the right. The largest absolute discrepancies occur in the inner disk at early times (red and orange curves, bottom left), whereas the fractional differences can exceed 200% in the mid and outer disk. The vertical dotted lines mark the first three pericentric passages of the last massive gas-rich merger. The shaded regions indicate the disk response to later dry mergers and a phase of ongoing minor interactions. These external events coincide with pronounced features in ∆SFR and ∆SFRfr, highlighting their role in triggering both enhanced star formation and accelerated stellar migration (see Fig. 5 for the corresponding dynamical signatures).
Current usage metrics show cumulative count of Article Views (full-text article views including HTML views, PDF and ePub downloads, according to the available data) and Abstracts Views on Vision4Press platform.
Data correspond to usage on the plateform after 2015. The current usage metrics is available 48-96 hours after online publication and is updated daily on week days.
Initial download of the metrics may take a while.