| Issue |
A&A
Volume 706, February 2026
|
|
|---|---|---|
| Article Number | A31 | |
| Number of page(s) | 10 | |
| Section | Galactic structure, stellar clusters and populations | |
| DOI | https://doi.org/10.1051/0004-6361/202556988 | |
| Published online | 30 January 2026 | |
The impact of radial migration on disk galaxy star formation histories
I. Biases in spatially resolved estimates
1
Leibniz-Institut für Astrophysik Potsdam (AIP),
An der Sternwarte 16,
14482
Potsdam,
Germany
2
Astrophysics Research Group, University of Surrey,
Guildford,
Surrey
GU2 7XH,
UK
3
Astrophysics Research Institute, Liverpool John Moores University,
146 Brownlow Hill,
Liverpool
L3 5RF,
UK
★ Corresponding author: This email address is being protected from spambots. You need JavaScript enabled to view it.
Received:
26
August
2025
Accepted:
9
December
2025
Abstract
Knowledge of the spatially resolved star formation history (SFH) of disk galaxies provides crucial insight into disk assembly, quenching, and chemical evolution. However, most reconstructions, both for the Milky Way and for external galaxies, implicitly assume that stars formed at their present-day radii. Using a range of zoom-in cosmological simulations, we show that stellar radial migration introduces strong and systematic biases in such SFH estimates, and in a Milky Way–like case study we link these biases directly to the disk’s merger-driven, non-axisymmetric response. In the inner disk (R ≲ hd), early star formation is typically underestimated by 25–50% and late star formation overestimated, giving the misleading impression of prolonged, moderate activity. An exception occurs in the most central bin considered (∼0.4hd), which is consistently overestimated due to a net inflow of inward migrators. At intermediate radii and in the outer disk, migration drives the opposite trend: intermediate-age populations are overestimated by 100–200% as stars born in the inner disk migrate outward, whereas genuinely in situ populations are underestimated by ∼50% as they themselves continue to migrate. The net effect is that SFH peaks are suppressed and broadened, and the true rate of inside-out disk growth is systematically underestimated. These distortions affect all galaxies in our sample and have direct implications for interpreting spatially resolved SFHs from integral field unit surveys such as CALIFA and MaNGA, where present-day radii are often used as proxies for stellar birth sites. Correcting these biases will require accounting for the disk mass, bar presence, disk kinematics and morphology, and recent birth-radius estimation techniques for Milky Way stars offer a promising path forward.
Key words: Galaxy: disk / Galaxy: evolution / Galaxy: formation / galaxies: formation / galaxies: kinematics and dynamics / galaxies: star formation
© The Authors 2026
 Open Access article, published by EDP Sciences, under the terms of the Creative Commons Attribution License (https://creativecommons.org/licenses/by/4.0), which permits unrestricted use, distribution, and reproduction in any medium, provided the original work is properly cited.
This article is published in open access under the Subscribe to Open model. This email address is being protected from spambots. You need JavaScript enabled to view it. to support open access publication.
1 Introduction
Estimates of the spatially resolved star formation history (SFH) of disk galaxies, including the Milky Way, are central to understanding galaxy formation and evolution. In nearby systems, stellar age distributions have typically been derived through color–magnitude diagram (CMD) modeling, using apparent luminosities and distance estimates (e.g., Gallart et al. 1999; Aparicio & Hidalgo 2009). This approach has been applied to galaxies such as M31 (Bernard et al. 2015), the Magellanic Clouds (Weisz et al. 2013; Cohen et al. 2024), and NGC 7792 (Sacchi et al. 2019), and in the Milky Way to the bulge (Bernard et al. 2018) and local disk (Ruiz-Lara et al. 2020; Gallart et al. 2024; Fernández-Alvar et al. 2025; del Alcázar-Julià et al. 2025) with Gaia data (Gaia Collaboration 2018, Gaia Collaboration 2023). These CMD-based results complement other SFH reconstruction techniques, such as fitting the observed age–[α/Fe] relation with chemical evolution models (e.g., Chiappini et al. 1997; Snaith et al. 2015; Haywood et al. 2016). Alternatively, the star formation rate (SFR) can be derived within a more comprehensive joint Bayesian inference framework where CMD information is an integral part of constraining the SFR and other Milky Way model parameters, alongside spatial and kinematic data (Sysoliatina & Just 2021).
For galaxies beyond the Local Group, the standard method for recovering a resolved SFH is spectral fitting of integrated light. Earlier work was reviewed by Walcher et al. (2011). More recent studies using large integral-field surveys such as the Calar Alto Legacy Integral Field Area survey (CALIFA) and Mapping Nearby Galaxies at Apache Point Observatory (MaNGA) have determined the spatially resolved SFHs for thousands of galaxies (e.g., Cid Fernandes et al. 2013; González Delgado et al. 2014, 2017; Wilkinson et al. 2015; Sánchez et al. 2019; Peterken et al. 2020). These results generally support the inside-out growth scenario (Pérez et al. 2013) and the persistence of the star formation main sequence to early cosmic times (Sánchez et al. 2019).
In both external galaxies and the Milky Way, the ultimate goal is to recover the distribution of stellar ages as a function of galactocentric radius, SFH(R). After correcting for survey selection effects and observational biases and accounting for the lifetimes of massive stars via the initial mass function, such estimates can be linked to the disk growth rate and the radial dependence of gas accretion and chemical enrichment (Matteucci & Francois 1989; Prantzos & Aubert 1995; Chiappini et al. 1997; Frankel et al. 2019). Bursts in the SFH may further trace disk–satellite interactions or episodes of gas inflow (Sotillo-Ramos et al. 2022; Di Cintio et al. 2021; Khoperskov et al. 2023; Annem & Khoperskov 2024; Zibetti et al. 2024; Wang et al. 2024), as well as instabilities occurring during bar buckling (Nepal et al. 2024).
A critical assumption underlying these efforts is that stars remain close to their birth radii, Rbirth. In reality, galactic disks host bars, spiral arms, and satellites that redistribute stellar angular momentum and drive radial migration (Sellwood & Binney 2002; Roškar et al. 2008a; Minchev et al. 2011; Vera-Ciro et al. 2014; Khoperskov et al. 2020; Marques et al. 2025; Zhang et al. 2025). For example, Baba (2025) used Milky Way–focused simulations to show that stellar age distributions at a fixed radius can depart strongly from the in situ SFH, due to the outward migration of stars born in the inner disk rather than a local SFR burst. Observations now indicate that a majority of stars in the solar vicinity were born at different radii and subsequently migrated, rather than having formed locally (e.g., Minchev et al. 2018; Frankel et al. 2020; Lu et al. 2024; Dantas et al. 2025).
This process, also known as radial mixing, has been predicted in simulations for decades (e.g., Wielen 1977; Friedli & Benz 1993; Debattista et al. 2006; Minchev & Quillen 2006) and is now recognized as essential for explaining chemo-kinematic observations in the Galaxy: the scatter and apparent flatness of the age–metallicity relation (Schönrich & Binney 2009; Minchev et al. 2013; Kubryk et al. 2015; Khoperskov et al. 2020; Prantzos et al. 2023), the metallicity distribution of the solar neigh-borhood (Hayden et al. 2015; Loebman et al. 2016; Miglio et al. 2021), the flattening of radial abundance gradients with stellar age (Anders et al. 2017; Renaud et al. 2025; Ratcliffe et al. 2025), and the structure of the [α/Fe]–[Fe/H] plane (Queiroz et al. 2020; Ratcliffe et al. 2023, 2025; Khoperskov et al. 2025a).
In addition to large-scale processes, stellar scattering off smaller structures can also redistribute orbits and shape galactic disks. Cloud–star scattering can generate and maintain exponential stellar profiles (Wu et al. 2020), while disk-halo gas flows (Struck & Elmegreen 2018) and interstellar holes and clumps (Struck & Elmegreen 2017) further redistribute stars, particularly in dwarf irregulars where star formation appears to occur from the outside in Zhang et al. (2012). Stochastic scattering models show that exponential profiles are a robust outcome of generic disk-like scattering (Elmegreen & Struck 2016). These processes are especially important in the outer regions of disks, where spirals and bars are less effective, highlighting the combined role of large- and small-scale mechanisms in shaping galactic structure.
In this study we quantified how stellar radial migration affects the recovery of spatially resolved SFHs in galactic disks.
Using a set of eight cosmological simulations with a range of morphologies and evolutionary histories, we traced stars from their true birth radii to their present-day positions. This allowed us to assess the magnitude, radial dependence, and systematic nature of the migration-induced biases, and to explore their implications for both the Milky Way and external integral field unit (IFU) surveys.
Properties of the simulations used in this work.
2 Simulations
The simulations we studied were presented by Martig et al. (2009, 2012). They come from a suite of 33 galaxies simulated from redshift 5 with redshift zero stellar masses ranging from 1 × 10¹⁰ to 2 × 10¹¹ M⊙. Dark matter haloes are selected in a large volume, dark matter-only simulation, performed using Λ-cold dark matter (ΛCDM) cosmology with the adaptive mesh refinement code RAMSES (Teyssier 2002). The boundary conditions used for the zoom-in simulation replicate all minor and major mergers as well as diffuse infall, as imposed by the initial cosmological simulation.
These zoom-in simulations use a spatial resolution of 150 pc and a mass resolution of 104−5 M⊙ (1.5 × 10⁴ M⊙ for gas, 7.5 × 10⁴ M⊙ for stars and 3 × 10⁵ M⊙ for dark matter particles). Stars formed during the simulation have the same mass as gas particles. To model gravity, the particle-mesh code described in Bournaud & Combes (2002) was used. Star formation is computed with a Schmidt-Kennicutt law (Kennicutt 1998) with an exponent of 1.5 and an efficiency of 2%. The star formation threshold is set at 0.03 M⊙pc−3. Energy feedback from supernovae explosions using a kinetic scheme as well as the continuous gas mass-loss from stars (Martig & Bournaud 2010) are included. More details on the zoom-in simulation technique can be found in Martig et al. (2009, 2012).
For this study we selected eight galaxies that span a range of bar sizes (or lack of a bar), disk scale lengths and masses. We refer to different models by their simulation number (g48, g59, etc.) We worked in units of disk scale lengths, hd, to facilitate comparisons between the different simulations. The masses and scale lengths are listed in Table 1, as measured by Martig et al. (2012). The models chosen for this work include five barred and three non-barred galaxies with face-on and edge-on morphologies shown in Figs. 1 and 2, respectively. Central bars are seen in g37, g48, g59, g82, g106, and g92 but not in g62 or g102. The strongest bars in terms of disk scale length is clearly seen for g92 (∼1.8hd), followed by g82. Many of the properties of these bars, such as their formation and evolution, are explored by Kraljic et al. (2012), and their effect on the disk dynamics has been studied quite extensively, for example the radial migration in g92 (Minchev et al. 2012a), disk heating using the full suite (Martig et al. 2014a,b), and the effect of bar fluctuations on velocity field, radial migration, and bar fluctuations in g106 (Carrillo et al. 2018; Hilmi et al. 2020; Vislosky et al. 2024; Marques et al. 2025).
At the last snapshots shown in Fig. 1 all galaxies show the presence of spiral arms, mostly dominated by m = 2 modes, except for g62 and g102 where multiple structures are seen. Possible matches to the Milky Way in terms of morphology would be g37, g106, and g92.
All galaxies in our sample experience significant merger activity at early times, consistent with expectations from ΛCDM cosmology and results from cosmological simulations. In particular, prior to 9 Gyr look-back time, all systems undergo multiple mergers, reflecting the hierarchical growth characteristic of galaxy formation. Satellites remain visible in the last snapshot shown in Fig. 1 and especially in Fig. 2. Table 1 summarizes the merger histories, listing only events with mass ratios more significant than 1:50 and occurring within the last 9 Gyr (look-back time). While some galaxies (e.g., g37, g82, and g92) are merger-free in this epoch, others such as g59 and g62 experience multiple interactions, including mergers as significant as 1:2 and 1:1. We expect such events – whether minor or major – to impact the SFH both by gravitationally perturbing the gas disk and by delivering fresh gas to the host galaxy, in addition to contributions from filamentary inflows and flyby interactions.
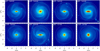 |
Fig. 1 Face-on views of all galactic disks at the final simulation time, in units of scale lengths, hd. The dotted circles indicate the outermost radial bin (4hd) considered in our analyses. |
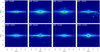 |
Fig. 2 Edge-on views of all galactic disks at the final simulation snapshot, shown in units of disk scale length, hd, as in Fig. 1. The dotted vertical lines mark the outermost radial bin (4hd) included in our analysis. The horizontal lines indicate the vertical birth cut, |z0| ≤ 0.3hd, used for all SFH estimates, which ensures that stars are selected as being born in the disk. |
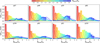 |
Fig. 3 Stellar final-radius distributions for ten birth radial bins of width 0.4hd, where hd is the radial scale length of each galaxy measured at the final time (Table 1). Significant radial migration is present in all disks. The Rfinal distributions are skewed toward larger radii for inner-disk bins and toward smaller radii for outer-disk bins. Overall, the disks extend by roughly one additional scale length owing to angular-momentum transport. |
3 Results
3.1 Radial migration in the simulations
To quantify the extent of radial migration over each galaxy’s lifetime, we started by dividing the stellar disk into ten equally spaced birth-radius annuli of width 0.4hd, thereby covering four disk scale lengths in total. To ensure that we selected stars genuinely formed in the disk, we restricted the sample to those with vertical birth positions within |z0| ≤ 0.3hd, where z0 is the distance from the mid-plane at the time of formation.
In Fig. 3, each panel shows the distribution of final radii, Rfinal, for stars born in a given annulus and the corresponding birth radius, Rbirth. The maximum of each Rfinal distribution determines the height of the Rbirth bar. Across all models, the distributions remain relatively symmetric at intermediate radii (∼2hd), but become increasingly skewed in both the inner and outer disk. Stars with Rbirth < 1.5hd tend to migrate outward, while those formed in the outer disk (Rbirth > 2.6hd) develop extended two-sided tails, often with peaks shifted inward. Notably, the disks extend by more than a scale length primarily due to stars born outside 2.6hd.
These trends demonstrate that radial migration is a major factor in shaping the present-day structure of all eight disks. While most Rfinal distributions still peak close to the stars’ birth radii, a significant fraction of stars have migrated, as seen in the broad and asymmetric tails. Both the magnitude and the direction of migration vary systematically with radius, implying that spatially resolved SFHs inferred at the present time will be biased unless migration effects are accounted for Roškar et al. (2008b); Brunetti et al. (2011); Minchev et al. (2012b). Crucially, such corrections must be radially dependent to capture the nonuniform impact of migration across the disk, as illustrated by Minchev et al. (2014).
3.2 SFHs determined using Rbirth versus Rfinal
Using the same radial bins as in Fig. 3, we computed the SFR surface density, defined as the mass of stars formed per unit disk area per unit time, with units of M⊙ pc−2 Gyr−1.
The top-left panel of Fig. 4 shows the SFR as a function of look-back time for model g106, evaluated at the stellar birth radius. We refer to this as the true SFH, or SFR(Rbirth). For stars born at Rbirth≲ 1hd (red curves), the SFR peaks between 7 and 10 Gyr ago. At larger birth radii, star formation occurs progressively later, consistent with an inside-out disk growth scenario (Matteucci & Francois 1989; Chiappini et al. 1997; Minchev et al. 2013; Frankel et al. 2019; Prantzos et al. 2023).
The first prominent SFR peak for stars with median Rbirth ≲ 1hd (red curves) in g106 arises from the initial coalescence of two massive, gas-rich satellites with the protogalaxy. The most significant merger after look-back time lbt = 9 Gyr begins with a pericentric passage at lbt ∼ 8.8 Gyr, involving a satellite with a mass ratio of 1:14 (see Table1). This encounter occurs within the inner scale length (measured at the final time), proceeds along a polar orbit, and can be linked to the second SFR peak in the top-left panel of Fig. 4. The second pericentric passage follows at lbt ∼ 7.7 Gyr, during which the orbit is strongly deflected by the central potential, transitioning from polar to in-plane – a behavior commonly seen in simulations. This allows the merger to affect the disk at radii outside 1hd. A third passage occurs at lbt ∼ 6.4 Gyr, after which the satellite is rapidly disrupted by lbt ∼ 6.7 Gyr. These three pericentric passages (marked by the vertical dotted lines in Fig. 4) coincide with the SF peaks in the birth-radius bins centered at 0.6hd, 1.0hd, and 1.4hd.
After the disruption of this last massive gas-rich satellite, g106 simultaneously undergoes two further, predominantly dry mergers with mass ratios of order 1:50, whose pericenters lie between lbt ∼ 6.5 and 4.9 Gyr (left shaded regions in Figs. 4 and 5). Because these satellites bring relatively little fresh gas, their imprint on SFR(Rbirth) is more modest than that of the 1:14 event. Nevertheless, they prolong the period of elevated star formation in the inner and intermediate bins and re-excite non-axisymmetric structure throughout the disk, producing secondary undulations that are visible in both SFR(Rbirth) and SFR(Rfinal).
Finally, the last prominent peak in the true SFH of g106 (top-left panel of Fig. 4), at lbt ∼ 3.5 Gyr, exhibits a stronger response in the intermediate and outer radial bins (blue and cyan curves), also suggesting an external trigger. Although a single, well-defined interaction is not apparent, the movie of this galaxy reveals numerous minor satellites in the vicinity at that time, which collectively perturbed the disk. Figure 5 shows a clear amplification of m = 1 and m = 2 modes at this time, indicating a collective disk response that we examine in more detail in Sect. 4.1. This behavior illustrates how even weak external perturbations can imprint distinct, localized fluctuations on top of the otherwise smooth inside-out growth of the disk.
To examine how an observer would infer the spatially resolved SFH from the final stellar radii, the top-right panel of Fig. 4 shows the SFR as a function of look-back time, using the same binning scheme as in the left panel but sorted by present-day radius, SFR(Rfinal). Strong discrepancies are immediately apparent: the initial burst of star formation in the inner disk (red and orange curves) is both diminished in amplitude and shifted toward younger look-back times. A further striking feature is that distinct star-formation peaks, clearly separated in SFR(Rbirth), appear aligned once radial mixing has redistributed stars, as in SFR(Rfinal). This behavior is consistently reproduced across our full sample of simulated galaxies (Fig. 6).
The bottom-left panel of Fig. 4 shows the absolute difference in SFH, defined as ∆SFR = SFR(Rbirth) − SFR(Rfinal), for each radial bin. The bottom-right panel displays the corresponding fractional difference, ∆SFRfr = ∆SFR/SFR(Rbirth). A positive value of ∆SFRfr indicates that using Rfinal underestimates the true SFR, and vice versa. In estimating ∆SFRfr, we set a threshold to avoid excessive values. This can be seen in the square appearance at ∆SFRfr = −2.3 for all galaxies (Fig. 6), where each system is shown in a three-panel block comparing SFR(Rbirth), SFR(Rfinal), and ∆SFHfr.
As expected, the largest discrepancies in stellar mass (bottom-left panel of Fig. 4) arise in the innermost radial bins, where stellar densities and SFRs are highest and where large-scale migration driven by mergers is most frequent at high redshift. The strong exchange between the inner two Rbirth bins is apparent both from the near-mirroring of their curves across the ∆SFR = 0 line and from their overlapping Rfinal distributions in Fig. 3. Stars born at hd = 1.4–2.6 migrate inward, giving the false impression of a more extended and less intense SFH in the inner disk. Consequently, the oldest bimodal peak in the true SFH is diminished by ∼20 M⊙ pc−2 Gyr−1, corresponding to a relative difference of about 30%, as shown in the bottom-right panel of Fig. 4.
Further examining ∆SFHfr (bottom-right panel of Fig. 4), we find systematic biases across the disk. At intermediate ages (lbt ∼ 7–11 Gyr), the outer regions show strong overestimates of the SFR, reaching 100–200%, while locally born stars in these bins are underestimated by about 50%. At later times (lbt ≲ 6 Gyr), the intermediate bins become underestimated, while the apparent SFR in the outskirts continues to rise, reaching ∼100% at lbt ∼ 1.5 Gyr.
A strong exchange is also visible across R ∼ 1–1.4 hd, where inner-disk curves (red) are underestimated by ∼30% while intermediate curves (orange-cyan) are simultaneously overestimated by up to 200%. This indicates substantial redistribution of stellar mass across this radius. Similar patterns are found in the other galaxies of our sample (Fig. 6), with the common feature that the outer disk SFR is consistently overestimated.
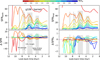 |
Fig. 4 Top: SFR for galaxy simulation g106, computed in bins of birth radius (left) and final radius (right), using the ten radial bins defined in Fig. 3. SFRs are measured in 1 Gyr-wide age bins, spaced by 0.2 Gyr, and have units of M⊙ pc−2 Gyr−1. To select stars formed in the disk, for all plots we apply a vertical cut at birth, |z0| ≤ 0.3hd, where hd is the disk scale length. To improve visibility across bins, the vertical axis is normalized to the second innermost bin. Bottom: absolute difference between the SFH computed from birth and final radii, ∆SFR = SFR(Rbirth) − SFR(Rfinal), shown on the left, and the corresponding fractional difference, ∆SFRfr = ∆SFR/SFR(Rbirth), shown on the right. The largest absolute discrepancies occur in the inner disk at early times (red and orange curves, bottom left), whereas the fractional differences can exceed 200% in the mid and outer disk. The vertical dotted lines mark the first three pericentric passages of the last massive gas-rich merger. The shaded regions indicate the disk response to later dry mergers and a phase of ongoing minor interactions. These external events coincide with pronounced features in ∆SFR and ∆SFRfr, highlighting their role in triggering both enhanced star formation and accelerated stellar migration (see Fig. 5 for the corresponding dynamical signatures). |
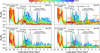 |
Fig. 5 Time evolution of normalized Fourier amplitudes, Am/A0, for m = 1 to m = 4 in simulation g106. Vertical dotted lines mark the first three pericentric passages of the last massive gas-rich merger, followed by a rapid sequence of additional close passages and complete disruption by lbt ∼ 6.7 Gyr. The shaded region to the left in each panel highlights the influence of two dry mergers (mass ratio of ∼1:50), with pericenters between lbt ∼ 6.5 and 4.9 Gyr. The right shaded region indicates a more chaotic phase, driven by a sequence of minor interactions (mass ratio ≳1:100). Bursts of multi-mode activity are seen near these events. Radial bins are color-coded as in Fig. 4. The timing of mode amplification closely mirrors SFR peaks, suggesting a causal link between external perturbations and disk structure. |
4 Discussion
4.1 Dynamical response to mergers in g106
To further illustrate the link between the SFH and the dynamical evolution of the disk, we analyzed the time evolution of non-axisymmetric Fourier modes in g106. Figure 5 shows the amplitudes of the m = 1 to m = 4 modes, normalized by the axisymmetric component A0, as a function of look-back time.
The coalescence of two massive, gas-rich mergers that trigger initial disk formation is seen as a strong disturbance in all four modes at lbt ≲ 9.5 Gyr. The first three pericentric passages associated with the last, gas-rich, massive merger align closely with the prominent SFR peaks for the birth-radius bins centered at hd ≈ 0.6, 1.0, and 1.4, respectively, in Fig. 4.
These encounters excite a strong lopsided response (m = 1), bar-like modes (m = 2, 4), and multi-armed spiral structure (m = 3, 4). The resulting patterns propagate from the inner to the outer disk as the initially polar satellite orbit gradually aligns with the disk plane by the third pericenter passage. As the amplitude of the outer spirals begins to decline around the time of the satellite’s full disruption, two smaller dry satellites start to interact with the host at intermediate and outer radii (Rbirth > 1.5hd), with pericenters between lbt ∼ 6.5 and 4.9, as indicated by the gray strip in Fig. 5.
At later times (lbt ∼ 3.5 Gyr), a sequence of minor flybys and dry mergers leads to a broad increase in amplitude across all modes, indicating that even weak perturbations can collectively induce measurable asymmetries in the stellar disk. Evidence that this is driven by external activity is that the m = 1 peak (deviation from bisymmetry) precedes the rise in m = 2 and m = 4. The strong correlation with the offsets in ∆SFH further indicates that these interactions not only enhance star formation but also drive significant radial migration – the latter is suggested by the symmetric exchange of mass between the inner and outer radii seen in ∆SFH.
It is intriguing that an early bar is triggered by the first peri-centric passage of the last massive merger at lbt ≈ 8.8 Gyr, visible as oscillatory behavior in m = 2 and m = 4 in the innermost bin (red curve). These high-frequency, periodic fluctuations in amplitude (as well as in bar length and pattern speed) are driven by bar–spiral interactions (Hilmi et al. 2020; Vislosky et al. 2024), which efficiently redistribute angular momentum at the bar–spiral interface (Minchev & Famaey 2010; Marques et al. 2025; Kwak et al. 2025). This initial bar is strongly perturbed by the subsequent passages and final disruption of the satellite (second and third peri in Fig. 5), after which a more stable phase of bar growth ensues, with oscillations shifting to larger radii (orange curves).
The early bar–spiral interaction, occurring in the very inner disk, is likely responsible for the nearly symmetric mass exchange observed at lbt ≈ 8 Gyr in the ∆SFH (bottom-left panel of Fig. 4), where the innermost radial bins exhibit mirrored offsets about zero. This symmetry suggests an internal redistribution mechanism that is consistent with torque-driven angular momentum transfer.
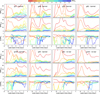 |
Fig. 6 SFHs for the full galaxy sample. Each system is shown in a vertical three-panel block. Top: SFR(Rbirth), the SFH binned by stellar birth radius. Middle: SFR(Rfinal), the SFH binned by present-day stellar radius. Bottom: fractional difference between the two, ∆SFHfr. Across the sample, a consistent pattern emerges: early inner-disk star formation is underestimated in SFR(Rfinal), while outer-disk star formation is strongly overestimated at intermediate ages, with fractional biases often exceeding 200%. These systematic effects reflect the redistribution of stars via radial migration. |
4.2 Merger imprints on the SFH
The wavy behavior of SFR with look-back time can be directly related to merger perturbations – both through the gas they bring in (especially at high redshifts) and through their dynamical impact on the host disk, which can trigger star formation (e.g., Scannapieco et al. 2009; Nuza et al. 2019; Khoperskov et al. 2023). In g106, for example, we show that pericentric passages from the last massive merger could be linked to three strong peaks around lbt = 6−9 Gyr, whereas the later peak at lbt ∼ 3.5 Gyr reflects the cumulative effect of several minor satellite perturbations.
Late major mergers, as in the case of g48, produce pronounced steps in the SFR around the time of the merger, with an extreme example seen in the strongly perturbed g59. By contrast, the most quiescent galaxy in our sample, g92 (see Martig et al. 2014a), displays a smoother SFR evolution with only three mild peaks.
Large peaks are often systematically offset in time across radii. For example, the outer disk shows a delay of about 1 Gyr relative to the inner disk in g48 at lbt ∼ 4 Gyr and in g106 at lbt ∼ 6 Gyr. This behavior is likely caused by pericentric passages of minor mergers with specific orbital properties. In contrast, smaller satellites tend to induce more localized, randomly distributed peaks in the SFR at different radii, as seen in g82 at lbt ∼ 3−7 Gyr. After migration, these peaks tend to align in time (second panel of each block in Fig. 6).
Bars provide another pathway to drive late-time star formation in the inner disk, provided gas is available. In g82, for example, a strong bar develops only 1–2 Gyr before the end of the simulation, triggered by a flyby interaction. Although its present-day morphology is indistinguishable from that of a galaxy where the bar formed earlier (see Fig. 1), the bar’s late emergence caused a sharp increase in SFR within the innermost radial bins. Although bars are typically found to form early in both simulations and observations, there have been indications of later bar formation in both external galaxies (de Sá-Freitas et al. 2025) and the Milky Way (e.g., Minchev et al. 2010; Nepal et al. 2024).
The structures described above suggest that variations in SFR with time and radius can be used to link disk SFHs to merger histories, including the number, timing, and orbital geometry of mergers (e.g., the angular momentum orientation, or whether the orbit is coplanar or polar). Such parameters are known to influence both stellar kinematics and star formation patterns (e.g., Kazantzidis et al. 2008; Moster et al. 2010; Pontzen et al. 2017; Khoperskov et al. 2019). While we highlighted these connections in the case of g106, a systematic exploration of how merger parameters map onto SFH features across the entire sample will be the subject of future work.
4.3 Implications for inside-out disk formation recovery
We find that, in general, stellar migration tends to bias SFR estimates within one disk scale length, leading to underestimation at early cosmic times and overestimation at later times (Figs. 4, 6). This produces the misleading appearance of prolonged, moderate inner-galaxy star formation, as the genuine peak is dampened and temporally broadened. While the relative differences (∆SFHfr) are typically smaller in the innermost bins than in the outskirts, the absolute impact on stellar mass is greatest in the inner disk owing to the steep exponential surface density profile of galactic disks.
The SFR outside the inner disk scale length is systematically misestimated, with strong overestimates at old and intermediate ages and deficits at young ages. This arises naturally from the outward transport of angular momentum in disks (Lynden-Bell & Kalnajs 1972; Minchev et al. 2011), predominantly affecting the outer regions at early times and the inner regions at later times, in line with an inside-out growth scenario.
More specifically, the outer disks are strongly overestimated (100–200%) at intermediate ages, when stars are not born there but migrate outward from the inner disk. By contrast, stars born locally at intermediate radii and the outskirts are typically underestimated by about 50%, as they themselves migrate further outward, leaving their birth bins depleted relative to the true in situ star formation. The combined effect is that the age distribution in any given radial bin is distorted: peaks are suppressed as stars migrate away, and the wings are broadened due to the influx of migrators.
Star formation also tends to quench earlier in the inner disk, especially in barred systems (Khoperskov et al. 2018; Géron et al. 2024; Ratcliffe et al. 2024; Renu et al. 2025). As a result, young stars observed there at late times are more likely to be inward migrators. Conversely, stars that migrate outward early in the disk’s history dominate the outer disk at times when in situ star formation was negligible.
A particularly strong exchange occurs across R ∼ 1–1.4hd, which has been shown to be a pivot point in flattening the metal-licity gradient in g106 (Minchev et al. 2013). This is driven by the strong angular momentum exchange across this radius, corresponding to the region just outside the bar’s corotation resonance (CR), where stars just inside CR tend to shift outward and those just outside shift inward. This effect is visible in g106: at lbt < 8 Gyr, the red curves (inner disk) are underestimated by ∼30%, while the yellow–cyan curves (intermediate radii) are overestimated by ∼200%. This is consistent with a roughly symmetric mass exchange across CR, modulated by the exponential surface density of the disk.
The net consequence is that reconstructions of spatially resolved SFHs from present-day stellar radii systematically underestimate early inner-disk star formation (by 25–50%), with the exception of the very innermost bin (∼0.4 hd), which is generally overestimated due to a net inflow from slightly larger radii, though in galaxies with late massive mergers it can instead be underestimated. Conversely, outer-disk star formation is overestimated by more than 200%. Together, these biases lead to an underestimation of the true rate of inside-out disk growth, with important consequences for measuring disk assembly histories and calibrating galaxy formation models. This is especially relevant for IFU surveys such as CALIFA and MaNGA (González Delgado et al. 2017), which often interpret present-day stellar positions as indicators of birth locations.
4.4 Limitations of age-based migration diagnostics
Our analysis quantifies the impact of radial migration on SFHs using only stellar ages. This approach is sensitive to net fluxes of stars across radial bins: if stars of a given age leave a bin without being replenished, the local SFR estimate is biased. However, if amount of mass migrate in, the reconstructed SFR–age relation remains unchanged, even though substantial exchange has taken place. In this sense, our estimates represent a lower limit on the full effect of migration.
Because metallicity gradients exist (e.g., Anders et al. 2017; Willett et al. 2023), such symmetric exchanges are not neutral chemically: stars of the same age born at smaller radii are more metal-rich than those formed farther out. Thus, to capture the hidden dimension of mixing, chemo-dynamical information must be combined with age-based SFHs. This is one of the goals of the spectroscopic Gaia follow-up survey 4MIDABLE-LR (Chiappini et al. 2019), which targets the Milky Way disk and bulge and will includes detailed chemical information.
5 Conclusions
We used a set of zoom-in cosmological simulations to quantify how radial migration affects estimates of the spatially resolved SFH of galactic disks. For each galaxy, we computed the SFH in radial bins using either stellar birth radii or present-day radii, and compared the resulting absolute and fractional differences (∆SFR and ∆SFRfr). We find that migration significantly distorts reconstructed SFHs, with systematic biases that depend on both radius and time:
Star formation histories inferred from present-day stellar positions systematically underestimate early star formation in the inner disk by 25–50% and overestimate outer-disk activity at later times by more than 200%. By contrast, the very central bin (∼0.4hd) is generally overestimated, owing to a net inflow from slightly larger radii, though in galaxies with late massive mergers it can instead be underestimated. Together, these effects lead to an underestimation of the true rate of inside-out disk growth.
Migration suppresses and broadens star formation peaks: subdominant bursts are washed out, while dominant events are redistributed across neighboring radii. Consequently, peaks inferred from stars near the solar neighborhood may have originated elsewhere or at different epochs.
A dynamical case study of the Milky Way–like system g106 links these SFH biases directly to the disk response to mergers. Gas-rich and subsequent dry satellites excite lopsidedness, bars, and multi-arm spirals whose Fourier amplitudes peak at the same epochs as the strongest deviations in ∆SFR and the nearly symmetric mass exchange between inner and outer radii, consistent with torque-driven radial migration.
A particularly strong exchange occurs across R ∼ 1–1.4hd in the case of barred disks – just outside bar corotation, where angular momentum transfer drives both SFH biases and metallicity gradient flattening. While barred and non-barred disks show similar average biases in our small sample (cf. Bernaldez et al. 2025), bars can accelerate inner-disk quenching and amplify exchanges near corotation.
These results caution against using present-day stellar radii as proxies for birth sites when reconstructing SFHs. They emphasize the need for migration-aware modeling when interpreting IFU surveys such as CALIFA and MaNGA, and for birth-radius estimation methods to recover robust disk assembly histories in the Milky Way.
In a forthcoming study (Bernaldez et al. 2025), we analyze a large sample of Milky Way- and Andromeda-like galaxies from TNG50 (Pillepich et al. 2024) to systematically assess how radial migration biases spatially resolved SFH reconstructions. This work demonstrates that the magnitude and direction of these biases depend strongly on bar strength, disk thickness, and merger history. Further investigation into the connection between galactic structure at the final simulation time and migration history will be valuable for developing corrections to observed SFH measurements in external galaxies.
In the Milky Way, various approaches are possible thanks to the availability of precise chemical, kinematic, and age information from the astrometric mission Gaia (Gaia Collaboration 2018, 2023), combined with existing and upcoming spectroscopic surveys, for example APOGEE (Majewski et al. 2017), SDSS-V (SDSS Collaboration 2025), WEAVE (Dalton et al. 2012), and 4MOST (de Jong et al. 2019), and asteroseismic missions, for example K2 (Howell et al. 2014), TESS (Ricker et al. 2015), and PLATO (Rauer et al. 2014). Corrections to SFH estimates at a given radius can be obtained by inferring stellar birth radii from chemical composition and age, as proposed in previous studies (Minchev et al. 2018; Lu et al. 2024; Ratcliffe et al. 2023, 2025; see also Frankel et al. 2018, 2020; Feltzing et al. 2020; Baba 2025). This approach is the focus of an upcoming work (Ratcliffe et al. 2026) that applies the Khoperskov et al. (2025b) orbital superposition method and Ratcliffe et al. (2025) birth radius estimates to APOGEE data.
Acknowledgements
We thank the anonymous referee for a thoughtful and constructive report, which led to significant improvements in the clarity and interpretation of our results. I.M. and B.R. acknowledge support by the Deutsche Forschungsgemeinschaft under the grant MI 2009/2-1. This work is based on the Master’s thesis of K. Attard (2019, Leibniz Institute for Astrophysics Potsdam, AIP).
References
- Anders, F., Chiappini, C., Minchev, I., et al. 2017, A&A, 600, A70 [NASA ADS] [CrossRef] [EDP Sciences] [Google Scholar]
- Annem, B., & Khoperskov, S. 2024, MNRAS, 527, 2426 [Google Scholar]
- Aparicio, A., & Hidalgo, S. L. 2009, AJ, 138, 558 [NASA ADS] [CrossRef] [Google Scholar]
- Baba, J. 2025, PASJ, 77, 916 [Google Scholar]
- Bernaldez, J. P., Minchev, I., Ratcliffe, B., et al. 2025, A&A, submitted [arXiv:2508.19340] [NASA ADS] [CrossRef] [EDP Sciences] [Google Scholar]
- Bernard, E. J., Ferguson, A. M. N., Chapman, S. C., et al. 2015, MNRAS, 453, L113 [Google Scholar]
- Bernard, E. J., Schultheis, M., Di Matteo, P., et al. 2018, MNRAS, 477, 3507 [CrossRef] [Google Scholar]
- Bournaud, F., & Combes, F. 2002, A&A, 392, 83 [NASA ADS] [CrossRef] [EDP Sciences] [Google Scholar]
- Brunetti, M., Chiappini, C., & Pfenniger, D. 2011, A&A, 534, A75 [NASA ADS] [CrossRef] [EDP Sciences] [Google Scholar]
- Carrillo, I., Minchev, I., Kordopatis, G., et al. 2018, MNRAS, 475, 2679 [NASA ADS] [CrossRef] [Google Scholar]
- Chiappini, C., Matteucci, F., & Gratton, R. 1997, ApJ, 477, 765 [Google Scholar]
- Chiappini, C., Minchev, I., Starkenburg, E., et al. 2019, The Messenger, 175, 30 [NASA ADS] [Google Scholar]
- Cid Fernandes, R., Pérez, E., García Benito, R., et al. 2013, A&A, 557, A86 [NASA ADS] [CrossRef] [EDP Sciences] [Google Scholar]
- Cohen, R. E., McQuinn, K. B. W., Murray, C. E., et al. 2024, ApJ, 975, 42 [Google Scholar]
- Dalton, G., Trager, S. C., Abrams, D. C., et al. 2012, Proc. SPIE, 8446, 84460P [Google Scholar]
- Dantas, M. L. L., Smiljanic, R., de Souza, R. S., Tissera, P. B., & Magrini, L. 2025, A&A, 696, A205 [NASA ADS] [CrossRef] [EDP Sciences] [Google Scholar]
- Debattista, V. P., Mayer, L., Carollo, C. M., et al. 2006, ApJ, 645, 209 [Google Scholar]
- de Jong, R. S., Agertz, O., Berbel, A. A., et al. 2019, The Messenger, 175, 3 [NASA ADS] [Google Scholar]
- del Alcázar-Julià, M., Figueras, F., Robin, A. C., Bienaymé, O., & Anders, F. 2025, A&A, 697, A128 [Google Scholar]
- de Sá-Freitas, C., Gadotti, D. A., Fragkoudi, F., et al. 2025, A&A, 698, A5 [NASA ADS] [CrossRef] [EDP Sciences] [Google Scholar]
- Di Cintio, A., Mostoghiu, R., Knebe, A., & Navarro, J. F. 2021, MNRAS, 506, 531 [NASA ADS] [CrossRef] [Google Scholar]
- Elmegreen, B. G., & Struck, C. 2016, ApJ, 830, 115 [Google Scholar]
- Feltzing, S., Bowers, J. B., & Agertz, O. 2020, MNRAS, 493, 1419 [Google Scholar]
- Fernández-Alvar, E., Ruiz-Lara, T., Gallart, C., et al. 2025, A&A, 704, A258 [NASA ADS] [CrossRef] [EDP Sciences] [Google Scholar]
- Frankel, N., Rix, H.-W., Ting, Y.-S., Ness, M., & Hogg, D. W. 2018, ApJ, 865, 96 [NASA ADS] [CrossRef] [Google Scholar]
- Frankel, N., Sanders, J., Rix, H.-W., Ting, Y.-S., & Ness, M. 2019, ApJ, 884, 99 [Google Scholar]
- Frankel, N., Sanders, J., Ting, Y.-S., & Rix, H.-W. 2020, ApJ, 896, 15 [NASA ADS] [CrossRef] [Google Scholar]
- Friedli, D., & Benz, W. 1993, A&A, 268, 65 [NASA ADS] [Google Scholar]
- Gaia Collaboration (Brown, A. G. A., et al.) 2018, A&A, 616, A1 [NASA ADS] [CrossRef] [EDP Sciences] [Google Scholar]
- Gaia Collaboration (Drimmel, R., et al.) 2023, A&A, 674, A37 [CrossRef] [EDP Sciences] [Google Scholar]
- Gallart, C., Freedman, W. L., Aparicio, A., Bertelli, G., & Chiosi, C. 1999, AJ, 118, 2245 [NASA ADS] [CrossRef] [Google Scholar]
- Gallart, C., Surot, F., Cassisi, S., et al. 2024, A&A, 687, A168 [NASA ADS] [CrossRef] [EDP Sciences] [Google Scholar]
- Géron, T., Smethurst, R. J., Lintott, C., et al. 2024, ApJ, 973, 129 [CrossRef] [Google Scholar]
- González Delgado, R. M., Pérez, E., Cid Fernandes, R., et al. 2014, A&A, 562, A47 [CrossRef] [EDP Sciences] [Google Scholar]
- González Delgado, R. M., Pérez, E., Cid Fernandes, R., et al. 2017, A&A, 607, A128 [NASA ADS] [CrossRef] [EDP Sciences] [Google Scholar]
- Hayden, M. R., Bovy, J., Holtzman, J. A., et al. 2015, ApJ, 808, 132 [Google Scholar]
- Haywood, M., Lehnert, M. D., Di Matteo, P., et al. 2016, A&A, 589, A66 [NASA ADS] [CrossRef] [EDP Sciences] [Google Scholar]
- Hilmi, T., Minchev, I., Buck, T., et al. 2020, MNRAS, 497, 933 [Google Scholar]
- Howell, S. B., Sobeck, C., Haas, M., et al. 2014, PASP, 126, 398 [Google Scholar]
- Kazantzidis, S., Bullock, J. S., Zentner, A. R., Kravtsov, A. V., & Moustakas, L. A. 2008, ApJ, 688, 254 [Google Scholar]
- Kennicutt, R. C., Jr. 1998, ApJ, 498, 541 [Google Scholar]
- Khoperskov, S., Haywood, M., Di Matteo, P., Lehnert, M. D., & Combes, F. 2018, A&A, 609, A60 [NASA ADS] [CrossRef] [EDP Sciences] [Google Scholar]
- Khoperskov, S., Di Matteo, P., Gerhard, O., et al. 2019, A&A, 622, L6 [NASA ADS] [CrossRef] [EDP Sciences] [Google Scholar]
- Khoperskov, S., Di Matteo, P., Haywood, M., Gómez, A., & Snaith, O. N. 2020, A&A, 638, A144 [NASA ADS] [CrossRef] [EDP Sciences] [Google Scholar]
- Khoperskov, S., Minchev, I., Libeskind, N., et al. 2023, A&A, 677, A89 [NASA ADS] [CrossRef] [EDP Sciences] [Google Scholar]
- Khoperskov, S., Steinmetz, M., Haywood, M., et al. 2025a, A&A, 700, A89 [NASA ADS] [CrossRef] [EDP Sciences] [Google Scholar]
- Khoperskov, S., van de Ven, G., Steinmetz, M., et al. 2025b, A&A, 695, A220 [NASA ADS] [CrossRef] [EDP Sciences] [Google Scholar]
- Kraljic, K., Bournaud, F., & Martig, M. 2012, ApJ, 757, 60 [Google Scholar]
- Kubryk, M., Prantzos, N., & Athanassoula, E. 2015, A&A, 580, A127 [NASA ADS] [CrossRef] [EDP Sciences] [Google Scholar]
- Kwak, S., Minchev, I., Pfrommer, C., Steinmetz, M., & Yi, S. K. 2025, A&A, submitted [arXiv:2511.21805] [Google Scholar]
- Loebman, S. R., Debattista, V. P., Nidever, D. L., et al. 2016, ApJ, 818, L6 [NASA ADS] [CrossRef] [Google Scholar]
- Lu, Y. L., Minchev, I., Buck, T., et al. 2024, MNRAS, 535, 392 [NASA ADS] [CrossRef] [Google Scholar]
- Lynden-Bell, D., & Kalnajs, A. J. 1972, MNRAS, 157, 1 [Google Scholar]
- Majewski, S. R., Schiavon, R. P., Frinchaboy, P. M., et al. 2017, AJ, 154, 94 [NASA ADS] [CrossRef] [Google Scholar]
- Marques, L., Minchev, I., Ratcliffe, B., et al. 2025, A&A, 701, A88 [NASA ADS] [CrossRef] [EDP Sciences] [Google Scholar]
- Martig, M., & Bournaud, F. 2010, ApJ, 714, L275 [NASA ADS] [CrossRef] [Google Scholar]
- Martig, M., Bournaud, F., Teyssier, R., & Dekel, A. 2009, ApJ, 707, 250 [Google Scholar]
- Martig, M., Bournaud, F., Croton, D. J., Dekel, A., & Teyssier, R. 2012, ApJ, 756, 26 [NASA ADS] [CrossRef] [Google Scholar]
- Martig, M., Minchev, I., & Flynn, C. 2014a, MNRAS, 442, 2474 [CrossRef] [Google Scholar]
- Martig, M., Minchev, I., & Flynn, C. 2014b, MNRAS, 443, 2452 [Google Scholar]
- Matteucci, F., & Francois, P. 1989, MNRAS, 239, 885 [Google Scholar]
- Miglio, A., Chiappini, C., Mackereth, J. T., et al. 2021, A&A, 645, A85 [NASA ADS] [CrossRef] [EDP Sciences] [Google Scholar]
- Minchev, I., & Famaey, B. 2010, ApJ, 722, 112 [Google Scholar]
- Minchev, I., & Quillen, A. C. 2006, MNRAS, 368, 623 [NASA ADS] [CrossRef] [Google Scholar]
- Minchev, I., Boily, C., Siebert, A., & Bienayme, O. 2010, MNRAS, 407, 2122 [CrossRef] [Google Scholar]
- Minchev, I., Famaey, B., Combes, F., et al. 2011, A&A, 527, 147 [Google Scholar]
- Minchev, I., Famaey, B., Quillen, A. C., et al. 2012a, A&A, 548, A127 [NASA ADS] [CrossRef] [EDP Sciences] [Google Scholar]
- Minchev, I., Famaey, B., Quillen, A. C., et al. 2012b, A&A, 548, A126 [NASA ADS] [CrossRef] [EDP Sciences] [Google Scholar]
- Minchev, I., Chiappini, C., & Martig, M. 2013, A&A, 558, A9 [CrossRef] [EDP Sciences] [Google Scholar]
- Minchev, I., Chiappini, C., & Martig, M. 2014, A&A, 572, A92 [CrossRef] [EDP Sciences] [Google Scholar]
- Minchev, I., Anders, F., Recio-Blanco, A., et al. 2018, MNRAS, 481, 1645 [NASA ADS] [CrossRef] [Google Scholar]
- Moster, B. P., Macciò, A. V., Somerville, R. S., Johansson, P. H., & Naab, T. 2010, MNRAS, 403, 1009 [NASA ADS] [CrossRef] [Google Scholar]
- Nepal, S., Chiappini, C., Guiglion, G., et al. 2024, A&A, 681, L8 [NASA ADS] [CrossRef] [EDP Sciences] [Google Scholar]
- Nuza, S. E., Scannapieco, C., Chiappini, C., et al. 2019, MNRAS, 482, 3089 [NASA ADS] [Google Scholar]
- Pérez, E., Cid Fernandes, R., González Delgado, R. M., et al. 2013, ApJ, 764, L1 [Google Scholar]
- Peterken, T., Merrifield, M., Aragón-Salamanca, A., et al. 2020, MNRAS, 495, 3387 [Google Scholar]
- Pillepich, A., Sotillo-Ramos, D., Ramesh, R., et al. 2024, MNRAS, 535, 1721 [NASA ADS] [CrossRef] [Google Scholar]
- Pontzen, A., Tremmel, M., Roth, N., et al. 2017, MNRAS, 465, 547 [Google Scholar]
- Prantzos, N., & Aubert, O. 1995, A&A, 302, 69 [NASA ADS] [Google Scholar]
- Prantzos, N., Abia, C., Chen, T., et al. 2023, MNRAS, 523, 2126 [NASA ADS] [CrossRef] [Google Scholar]
- Queiroz, A. B. A., Anders, F., Chiappini, C., et al. 2020, A&A, 638, A76 [NASA ADS] [CrossRef] [EDP Sciences] [Google Scholar]
- Ratcliffe, B., Minchev, I., Anders, F., et al. 2023, MNRAS, 525, 2208 [NASA ADS] [CrossRef] [Google Scholar]
- Ratcliffe, B., Khoperskov, S., Minchev, I., et al. 2024, A&A, 690, A352 [NASA ADS] [CrossRef] [EDP Sciences] [Google Scholar]
- Ratcliffe, B., Khoperskov, S., Minchev, I., et al. 2025, A&A, 698, A267 [NASA ADS] [CrossRef] [EDP Sciences] [Google Scholar]
- Ratcliffe, B., Khoperskov, S., Lee, N., et al. 2026, A&A, in press, https://doi.org/10.1051/0004-6361/202557057 [NASA ADS] [CrossRef] [EDP Sciences] [Google Scholar]
- Rauer, H., Catala, C., Aerts, C., et al. 2014, Exp. Astron., 38, 249 [Google Scholar]
- Renaud, F., Ratcliffe, B., Minchev, I., et al. 2025, A&A, 694, A56 [NASA ADS] [CrossRef] [EDP Sciences] [Google Scholar]
- Renu, D., Subramanian, S., Rao, S., & George, K. 2025, A&A, 696, A118 [NASA ADS] [CrossRef] [EDP Sciences] [Google Scholar]
- Ricker, G. R., Winn, J. N., Vanderspek, R., et al. 2015, J. Astron. Teles. Instrum. Syst., 1, 014003 [Google Scholar]
- Roškar, R., Debattista, V. P., Quinn, T. R., Stinson, G. S., & Wadsley, J. 2008a, ApJ, 684, L79 [Google Scholar]
- Roškar, R., Debattista, V. P., Stinson, G. S., et al. 2008b, ApJ, 675, L65 [Google Scholar]
- Ruiz-Lara, T., Gallart, C., Bernard, E. J., & Cassisi, S. 2020, Nature Astronomy, 4, 965 [Google Scholar]
- Sacchi, E., Cignoni, M., Aloisi, A., et al. 2019, ApJ, 878, 1 [NASA ADS] [CrossRef] [Google Scholar]
- Sánchez, S. F., Avila-Reese, V., Rodríguez-Puebla, A., et al. 2019, MNRAS, 482, 1557 [Google Scholar]
- Scannapieco, C., White, S. D. M., Springel, V., & Tissera, P. B. 2009, MNRAS, 396, 696 [NASA ADS] [CrossRef] [Google Scholar]
- Schönrich, R., & Binney, J. 2009, MNRAS, 396, 203 [Google Scholar]
- SDSS Collaboration, (Adamane Pallathadka, G., et al.) 2025, AAS Journals, submitted [arXiv:2507.07093] [Google Scholar]
- Sellwood, J. A., & Binney, J. J. 2002, MNRAS, 336, 785 [Google Scholar]
- Snaith, O., Haywood, M., Di Matteo, P., et al. 2015, A&A, 578, A87 [NASA ADS] [CrossRef] [EDP Sciences] [Google Scholar]
- Sotillo-Ramos, D., Pillepich, A., Donnari, M., et al. 2022, MNRAS, 516, 5404 [NASA ADS] [CrossRef] [Google Scholar]
- Struck, C., & Elmegreen, B. G. 2017, MNRAS, 469, 1157 [NASA ADS] [CrossRef] [Google Scholar]
- Struck, C., & Elmegreen, B. G. 2018, ApJ, 868, L15 [Google Scholar]
- Sysoliatina, K., & Just, A. 2021, A&A, 647, A39 [NASA ADS] [CrossRef] [EDP Sciences] [Google Scholar]
- Teyssier, R. 2002, A&A, 385, 337 [CrossRef] [EDP Sciences] [Google Scholar]
- Vera-Ciro, C., D’Onghia, E., Navarro, J., & Abadi, M. 2014, ApJ, 794, 173 [NASA ADS] [CrossRef] [Google Scholar]
- Vislosky, E., Minchev, I., Khoperskov, S., et al. 2024, MNRAS, 528, 3576 [NASA ADS] [CrossRef] [Google Scholar]
- Walcher, J., Groves, B., Budavári, T., & Dale, D. 2011, Ap & SS, 331, 1 [NASA ADS] [CrossRef] [Google Scholar]
- Wang, Z., Sharma, S., Hayden, M. R., et al. 2024, MNRAS, 534, 1175 [NASA ADS] [CrossRef] [Google Scholar]
- Weisz, D. R., Dolphin, A. E., Skillman, E. D., et al. 2013, MNRAS, 431, 364 [Google Scholar]
- Wielen, R. 1977, A&A, 60, 263 [NASA ADS] [Google Scholar]
- Wilkinson, D. M., Maraston, C., Thomas, D., et al. 2015, MNRAS, 449, 328 [NASA ADS] [CrossRef] [Google Scholar]
- Willett, E., Miglio, A., Mackereth, J. T., et al. 2023, MNRAS, 526, 2141 [NASA ADS] [CrossRef] [Google Scholar]
- Wu, J., Struck, C., D’Onghia, E., & Elmegreen, B. G. 2020, MNRAS, 499, 2672 [NASA ADS] [CrossRef] [Google Scholar]
- Zhang, H.-X., Hunter, D. A., Elmegreen, B. G., Gao, Y., & Schruba, A. 2012, AJ, 143, 47 [NASA ADS] [CrossRef] [Google Scholar]
- Zhang, H., Belokurov, V., Evans, N. W., et al. 2025, ApJ, 983, L10 [Google Scholar]
- Zibetti, S., Rossi, E., & Gallazzi, A. R. 2024, MNRAS, 528, 2790 [NASA ADS] [CrossRef] [Google Scholar]
All Tables
All Figures
|
Fig. 1 Face-on views of all galactic disks at the final simulation time, in units of scale lengths, hd. The dotted circles indicate the outermost radial bin (4hd) considered in our analyses. |
| In the text | |
|
Fig. 2 Edge-on views of all galactic disks at the final simulation snapshot, shown in units of disk scale length, hd, as in Fig. 1. The dotted vertical lines mark the outermost radial bin (4hd) included in our analysis. The horizontal lines indicate the vertical birth cut, |z0| ≤ 0.3hd, used for all SFH estimates, which ensures that stars are selected as being born in the disk. |
| In the text | |
|
Fig. 3 Stellar final-radius distributions for ten birth radial bins of width 0.4hd, where hd is the radial scale length of each galaxy measured at the final time (Table 1). Significant radial migration is present in all disks. The Rfinal distributions are skewed toward larger radii for inner-disk bins and toward smaller radii for outer-disk bins. Overall, the disks extend by roughly one additional scale length owing to angular-momentum transport. |
| In the text | |
|
Fig. 4 Top: SFR for galaxy simulation g106, computed in bins of birth radius (left) and final radius (right), using the ten radial bins defined in Fig. 3. SFRs are measured in 1 Gyr-wide age bins, spaced by 0.2 Gyr, and have units of M⊙ pc−2 Gyr−1. To select stars formed in the disk, for all plots we apply a vertical cut at birth, |z0| ≤ 0.3hd, where hd is the disk scale length. To improve visibility across bins, the vertical axis is normalized to the second innermost bin. Bottom: absolute difference between the SFH computed from birth and final radii, ∆SFR = SFR(Rbirth) − SFR(Rfinal), shown on the left, and the corresponding fractional difference, ∆SFRfr = ∆SFR/SFR(Rbirth), shown on the right. The largest absolute discrepancies occur in the inner disk at early times (red and orange curves, bottom left), whereas the fractional differences can exceed 200% in the mid and outer disk. The vertical dotted lines mark the first three pericentric passages of the last massive gas-rich merger. The shaded regions indicate the disk response to later dry mergers and a phase of ongoing minor interactions. These external events coincide with pronounced features in ∆SFR and ∆SFRfr, highlighting their role in triggering both enhanced star formation and accelerated stellar migration (see Fig. 5 for the corresponding dynamical signatures). |
| In the text | |
|
Fig. 5 Time evolution of normalized Fourier amplitudes, Am/A0, for m = 1 to m = 4 in simulation g106. Vertical dotted lines mark the first three pericentric passages of the last massive gas-rich merger, followed by a rapid sequence of additional close passages and complete disruption by lbt ∼ 6.7 Gyr. The shaded region to the left in each panel highlights the influence of two dry mergers (mass ratio of ∼1:50), with pericenters between lbt ∼ 6.5 and 4.9 Gyr. The right shaded region indicates a more chaotic phase, driven by a sequence of minor interactions (mass ratio ≳1:100). Bursts of multi-mode activity are seen near these events. Radial bins are color-coded as in Fig. 4. The timing of mode amplification closely mirrors SFR peaks, suggesting a causal link between external perturbations and disk structure. |
| In the text | |
|
Fig. 6 SFHs for the full galaxy sample. Each system is shown in a vertical three-panel block. Top: SFR(Rbirth), the SFH binned by stellar birth radius. Middle: SFR(Rfinal), the SFH binned by present-day stellar radius. Bottom: fractional difference between the two, ∆SFHfr. Across the sample, a consistent pattern emerges: early inner-disk star formation is underestimated in SFR(Rfinal), while outer-disk star formation is strongly overestimated at intermediate ages, with fractional biases often exceeding 200%. These systematic effects reflect the redistribution of stars via radial migration. |
| In the text | |
Current usage metrics show cumulative count of Article Views (full-text article views including HTML views, PDF and ePub downloads, according to the available data) and Abstracts Views on Vision4Press platform.
Data correspond to usage on the plateform after 2015. The current usage metrics is available 48-96 hours after online publication and is updated daily on week days.
Initial download of the metrics may take a while.