Fig. 5
Download original image
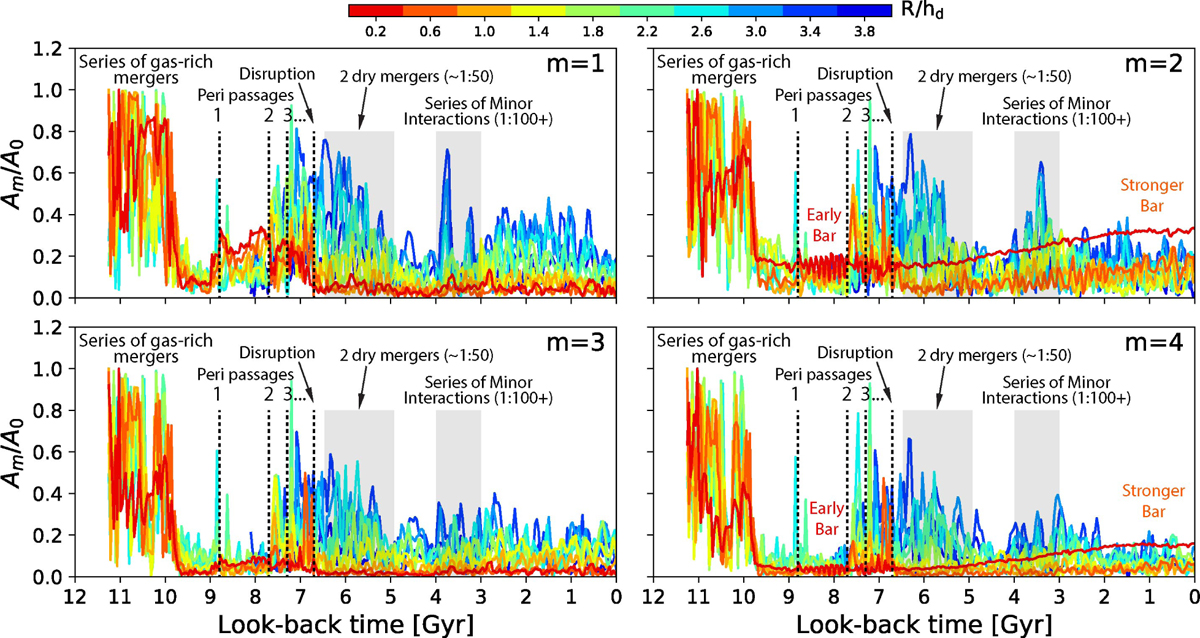
Time evolution of normalized Fourier amplitudes, Am/A0, for m = 1 to m = 4 in simulation g106. Vertical dotted lines mark the first three pericentric passages of the last massive gas-rich merger, followed by a rapid sequence of additional close passages and complete disruption by lbt ∼ 6.7 Gyr. The shaded region to the left in each panel highlights the influence of two dry mergers (mass ratio of ∼1:50), with pericenters between lbt ∼ 6.5 and 4.9 Gyr. The right shaded region indicates a more chaotic phase, driven by a sequence of minor interactions (mass ratio ≳1:100). Bursts of multi-mode activity are seen near these events. Radial bins are color-coded as in Fig. 4. The timing of mode amplification closely mirrors SFR peaks, suggesting a causal link between external perturbations and disk structure.
Current usage metrics show cumulative count of Article Views (full-text article views including HTML views, PDF and ePub downloads, according to the available data) and Abstracts Views on Vision4Press platform.
Data correspond to usage on the plateform after 2015. The current usage metrics is available 48-96 hours after online publication and is updated daily on week days.
Initial download of the metrics may take a while.