Fig. 4.
Download original image
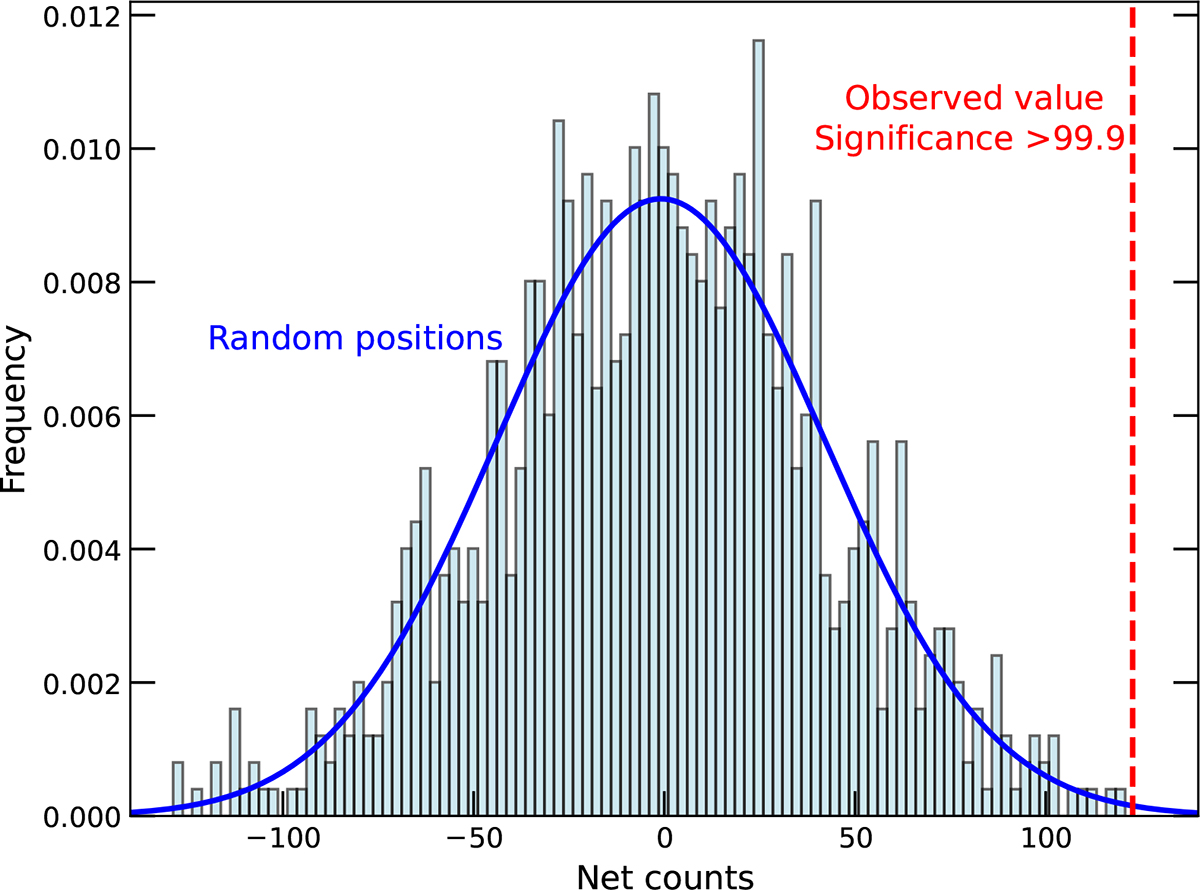
Distribution of stacked net-counts in the UHB for 1000 realizations of random positions (cyan histogram). The number of stacked net counts obtained for the type 2 AGN sample is marked with the dashed red line. All of the random realizations return a lower number of net counts, implying a significance of > 0.999 of the stacked emission from the type 2 AGN sample.
Current usage metrics show cumulative count of Article Views (full-text article views including HTML views, PDF and ePub downloads, according to the available data) and Abstracts Views on Vision4Press platform.
Data correspond to usage on the plateform after 2015. The current usage metrics is available 48-96 hours after online publication and is updated daily on week days.
Initial download of the metrics may take a while.