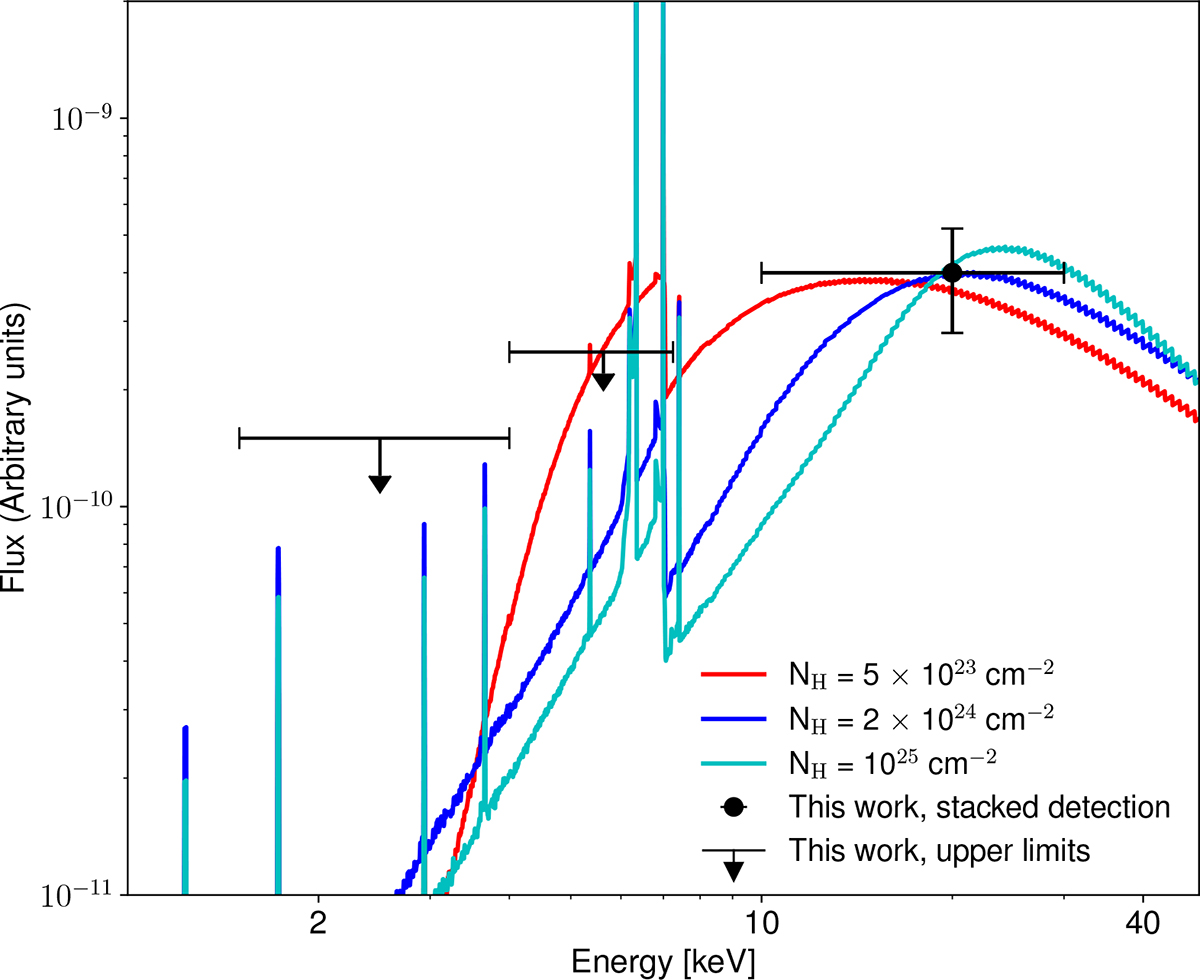
Fig. 5.
Download original image
Spectral models computed with the uxclumpy code described in (Buchner et al. 2019) rescaled to the observed 10–30 keV flux from the stacking analysis. We refer to the text for details on the model assumptions and geometry. The column density increases from 5 × 1023 cm−2 (red curve) to 2 × 1024 cm−2 (blue curve) and 1025 cm−2 (cyan curve). The UHB detection and the upper limits in the SB and MB are also reported.
Current usage metrics show cumulative count of Article Views (full-text article views including HTML views, PDF and ePub downloads, according to the available data) and Abstracts Views on Vision4Press platform.
Data correspond to usage on the plateform after 2015. The current usage metrics is available 48-96 hours after online publication and is updated daily on week days.
Initial download of the metrics may take a while.