Fig. 6.
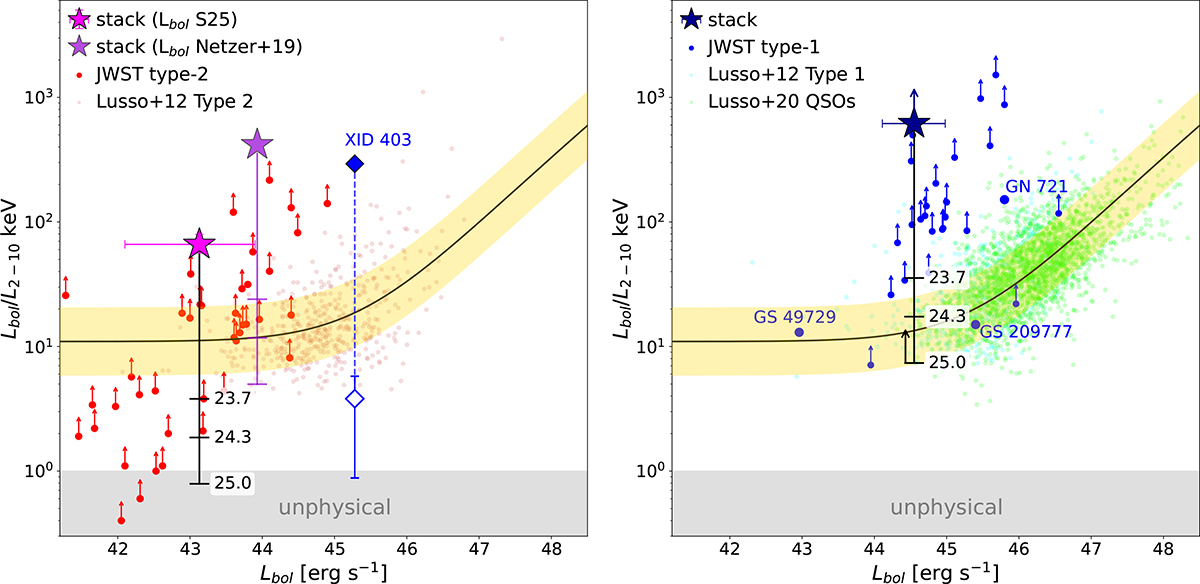
Download original image
Left: Ratio of the AGN bolometric luminosity and the X-ray luminosity as a function of the bolometric luminosity for type 2 AGN. The small brown points represent X-ray-selected type 2 AGN in COSMOS (Lusso et al. 2012). The red points are the lower limits obtained for each JWST type 2 source in M25. The magenta star shows the kbol obtained from the observed 2–10 keV luminosity derived from the 10–30 keV stacked detection assuming a Compton-thick spectrum with NH = 2 × 1024 cm−2 (blue curve in Figure 5), at the median Lbol of the sample. The horizontal error bar corresponds to the 16th and 84th percentiles of the observed distribution of bolometric luminosities in the stacked sample. The kbol corresponding to absorption-corrected intrinsic luminosities derived for NH of 5 × 10²³, 2 × 1024, and 1025 cm−2 is shown with the black error bars. The violet data point is equivalent to the magenta one, but Lbol is derived from [O III] using the Netzer (2019) bolometric correction. The X-ray-detected heavily obscured source XID 403 is shown with a blue diamond. The kbol, X from the de-absorbed luminosity is shown with the empty symbol. Right: Same as the left panel, but for type 1 AGN. The green and cyan small points represent X-ray-selected type 1 AGN in COSMOS from Lusso et al. (2012) and QSOs from Lusso et al. (2020). The blue points are lower limits and detections for type 1 sources in M25. The dark blue star indicates the kbol limit for the stacked type 1 sources in the CDFN obtained from the observed upper limits assuming a spectrum with Γ = 1.7. The black error bars were computed using the same assumptions as for the type 2 sample in the left panel. The horizontal error bar corresponds to the 16th and 84th percentiles of the observed distribution of bolometric luminosities in the stacked sample (see text for a more detailed description). In both panels, the black continuous line shows the kbol, X − Lbol relation from (Duras et al. 2020) while the gold area shows the scatter. The region below kbol = 1 is marked as unphysical as it would imply that L2 − 10 keV > Lbol.
Current usage metrics show cumulative count of Article Views (full-text article views including HTML views, PDF and ePub downloads, according to the available data) and Abstracts Views on Vision4Press platform.
Data correspond to usage on the plateform after 2015. The current usage metrics is available 48-96 hours after online publication and is updated daily on week days.
Initial download of the metrics may take a while.