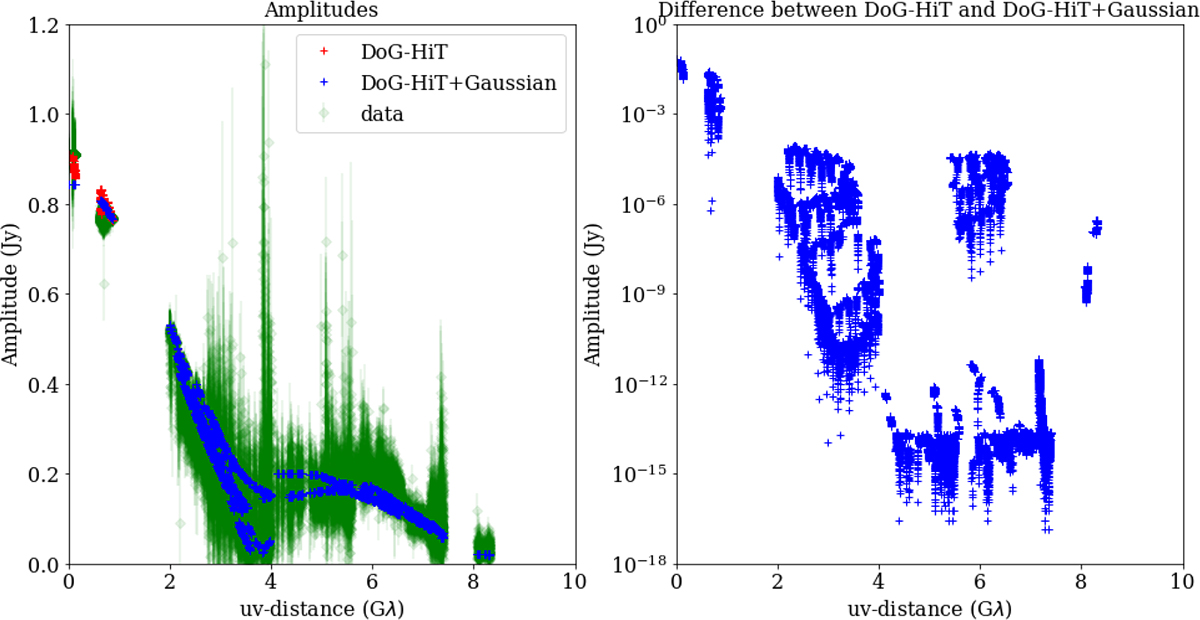
Fig. B.2.
Download original image
Left panel: comparison of the predicted amplitudes for the DoG-HIT ring-only image (red markers), the DoG-HIT image with additional Gaussian component (blue markers), and the self-calibrated visibility amplitudes (green markers) as a function of projected baseline length. Right panel: the difference between the predicted visibilities for the DoG-HIT model and DoG-HIT with the additional Gaussian component as a function of projected baseline length. The plot demonstrates that the additional Gaussian component has no sizeable effect on baselines longer than PV-NOEMA.
Current usage metrics show cumulative count of Article Views (full-text article views including HTML views, PDF and ePub downloads, according to the available data) and Abstracts Views on Vision4Press platform.
Data correspond to usage on the plateform after 2015. The current usage metrics is available 48-96 hours after online publication and is updated daily on week days.
Initial download of the metrics may take a while.