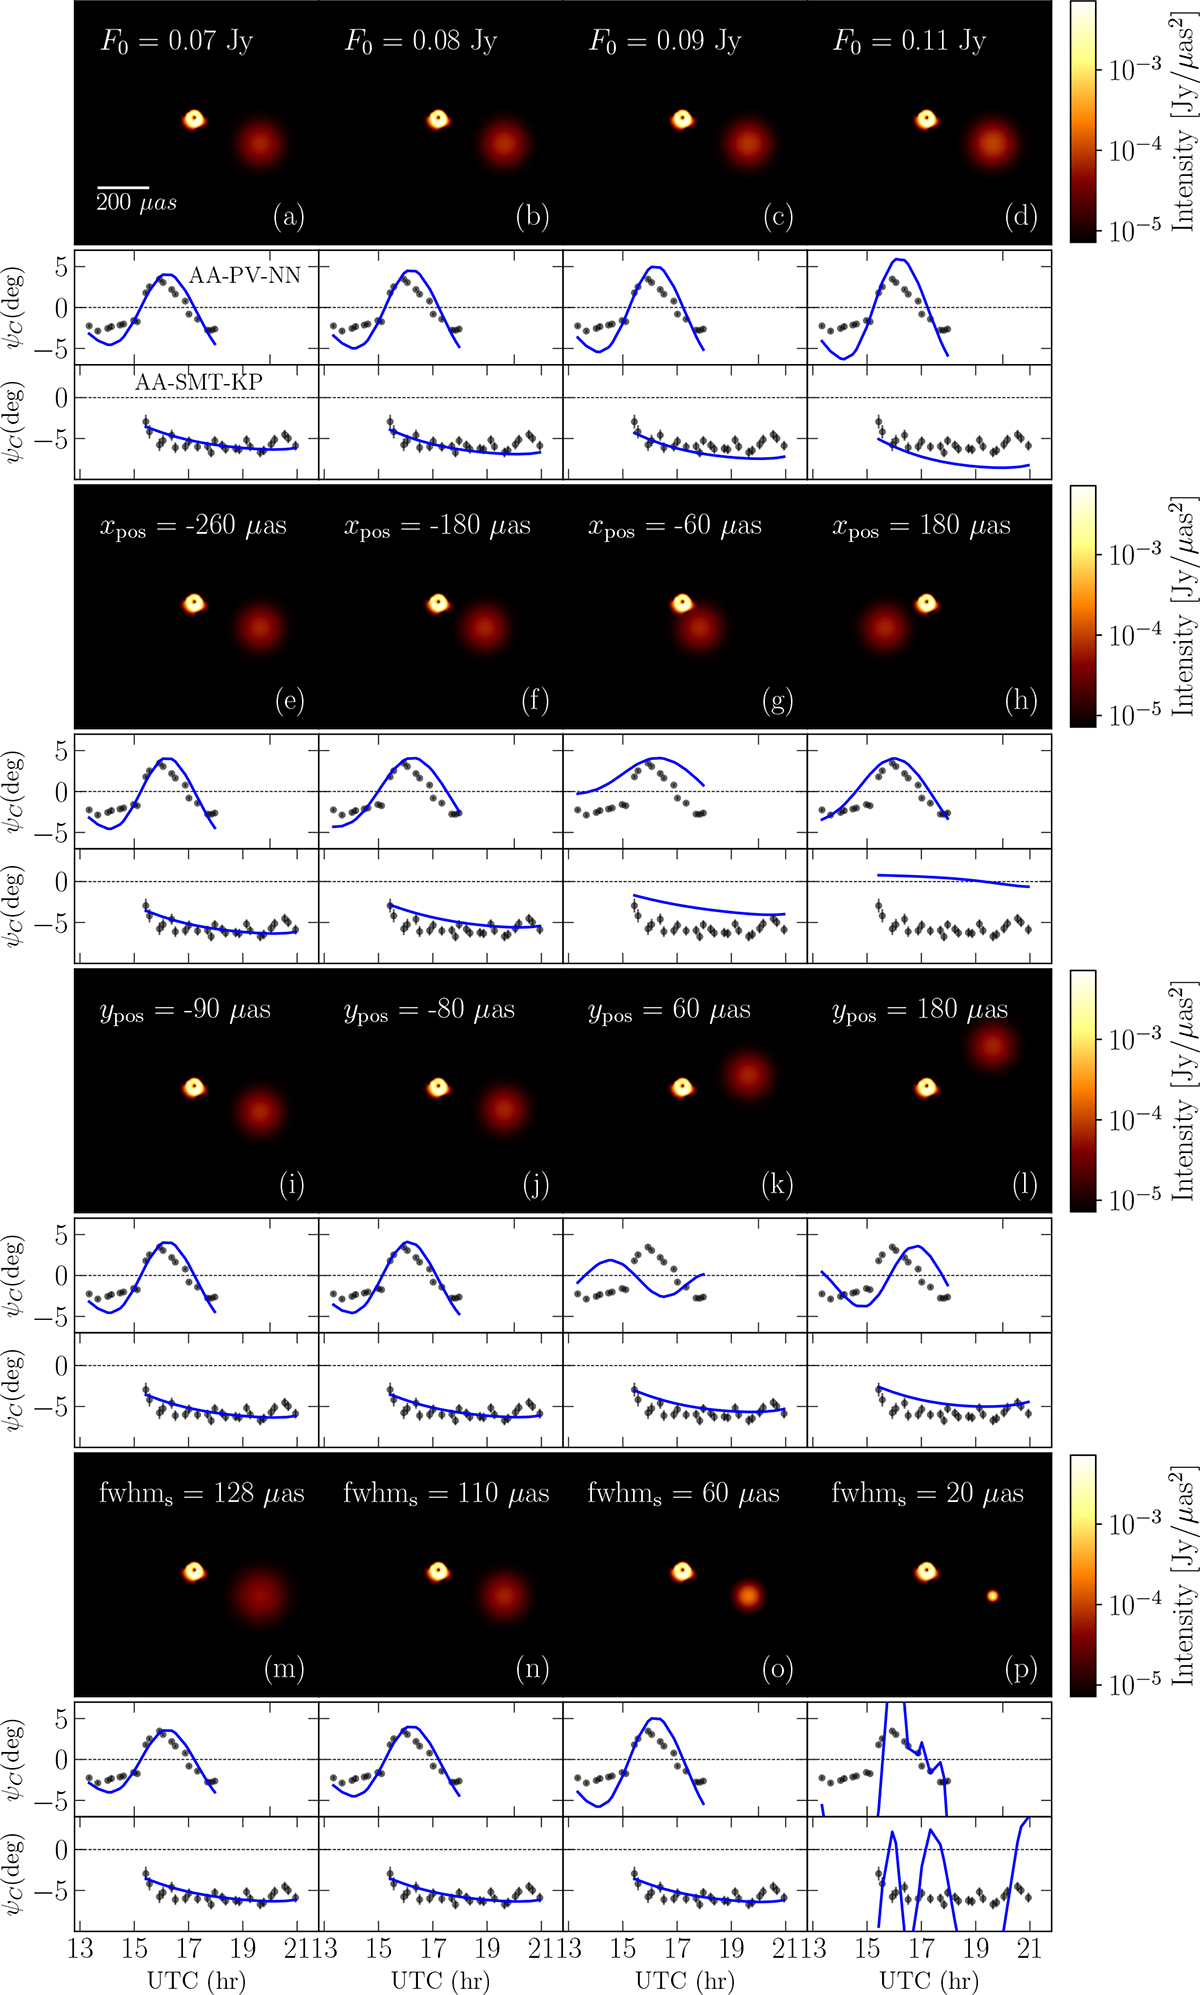
Fig. 3.
Download original image
Symmetric Gaussian component with varying parameters over the reconstructed DoG-HIT image as represented in Figure 1 represented in log scale. Different rows correspond to changes in the values of different parameters (see text for details). The solid lines represents the corresponding complete model (ring + Gaussian) closure phases on the respective triangles.
Current usage metrics show cumulative count of Article Views (full-text article views including HTML views, PDF and ePub downloads, according to the available data) and Abstracts Views on Vision4Press platform.
Data correspond to usage on the plateform after 2015. The current usage metrics is available 48-96 hours after online publication and is updated daily on week days.
Initial download of the metrics may take a while.