Fig. 5.
Download original image
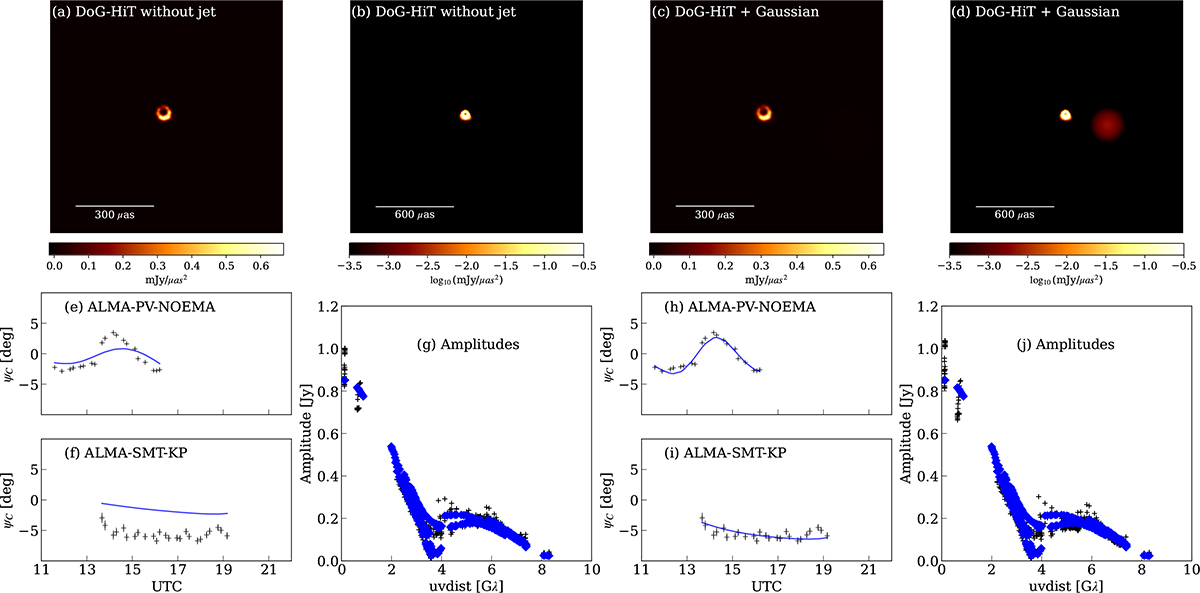
Ring-only DoG-HIT image (panel a: linear scale, panel b: logarithmic scale) compared to the DoG-HIT ring image with an additional Gaussian (panel c and d). In the bottom row, we show the fit to the bump and offset in closure phases and the fit to the amplitudes for DoG-HIT (panels e,f,g) and for DoG-HIT with the symmetric Gaussian component added (panels h,i,j).
Current usage metrics show cumulative count of Article Views (full-text article views including HTML views, PDF and ePub downloads, according to the available data) and Abstracts Views on Vision4Press platform.
Data correspond to usage on the plateform after 2015. The current usage metrics is available 48-96 hours after online publication and is updated daily on week days.
Initial download of the metrics may take a while.