Fig. 4
Download original image
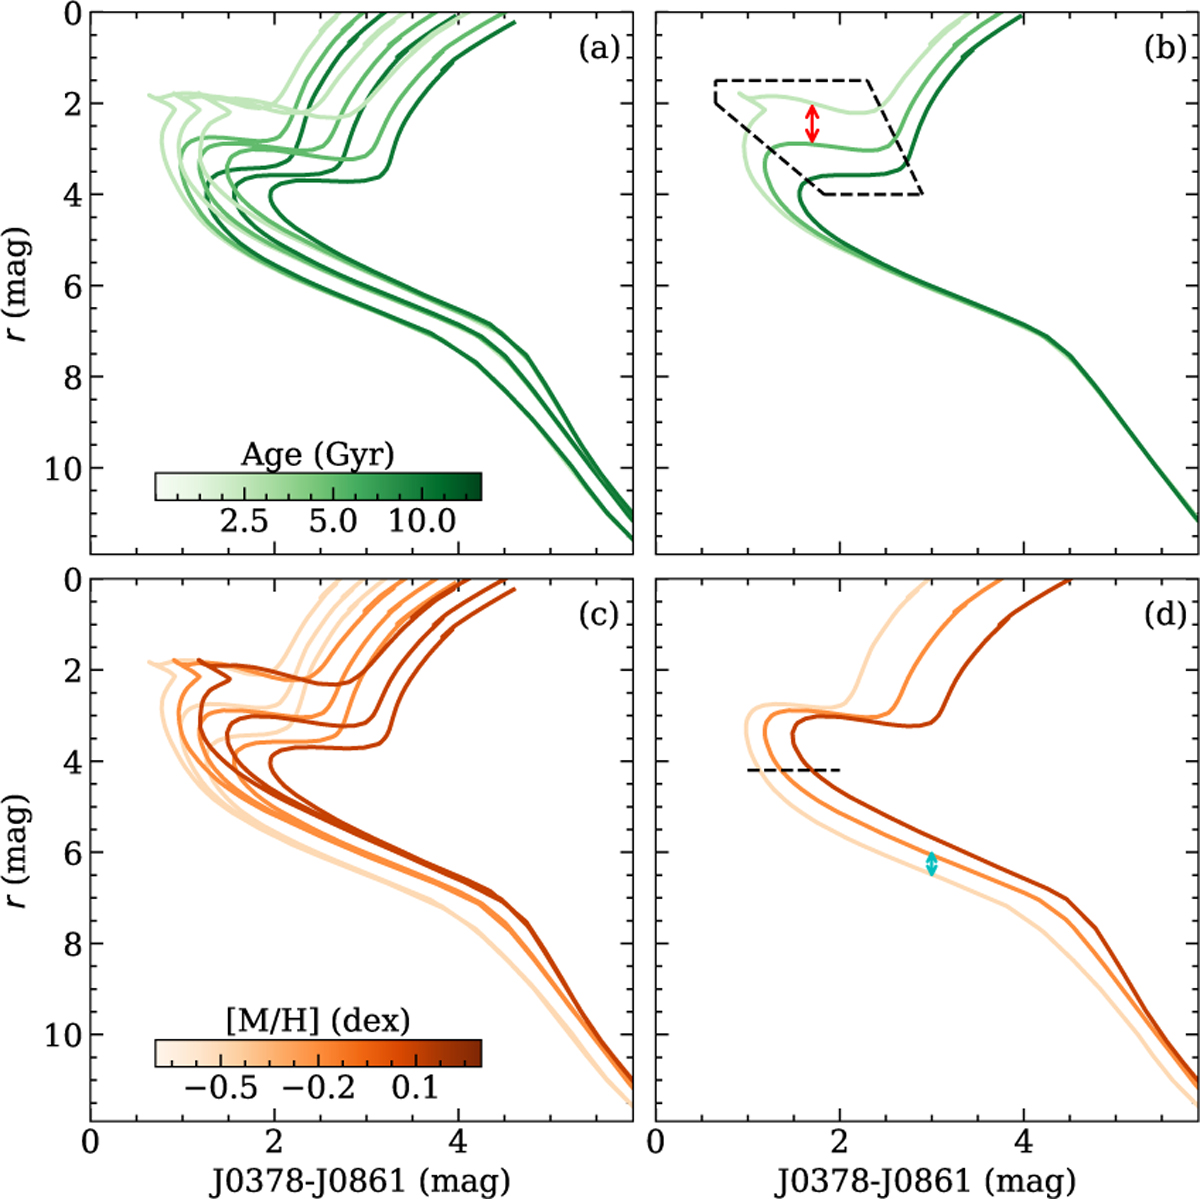
Illustrative isochrone plot. Panel a displays a grid of nine isochrones with ages of 2.5, 5, and 10 Gyr and metallicities of [M/H] = −0.5, −0.2, and 0.1 dex. Isochrones with the same age are shown in green tones, illustrating the sensitivity of age and metallicity at the MSTO and the RGB phases. Panel b highlights the region of the CAMD where age sensitivity is highest (dashed polygon) using three isochrones of the same metallicity ([M/H] = −0.2 dex). The double-headed red arrow indicates the magnitude separation used to quantify the average distance between isochrones. Panel c shows the same grid as (a), but with orange tones indicating isochrones of the same metallicity. Panel d shows three isochrones of the same age (5 Gyr), illustrating how magnitude and colour vary with metallicity. The cyan arrow indicates the magnitude separation used to define the average distance between isochrones.
Current usage metrics show cumulative count of Article Views (full-text article views including HTML views, PDF and ePub downloads, according to the available data) and Abstracts Views on Vision4Press platform.
Data correspond to usage on the plateform after 2015. The current usage metrics is available 48-96 hours after online publication and is updated daily on week days.
Initial download of the metrics may take a while.