Fig. 1.
Download original image
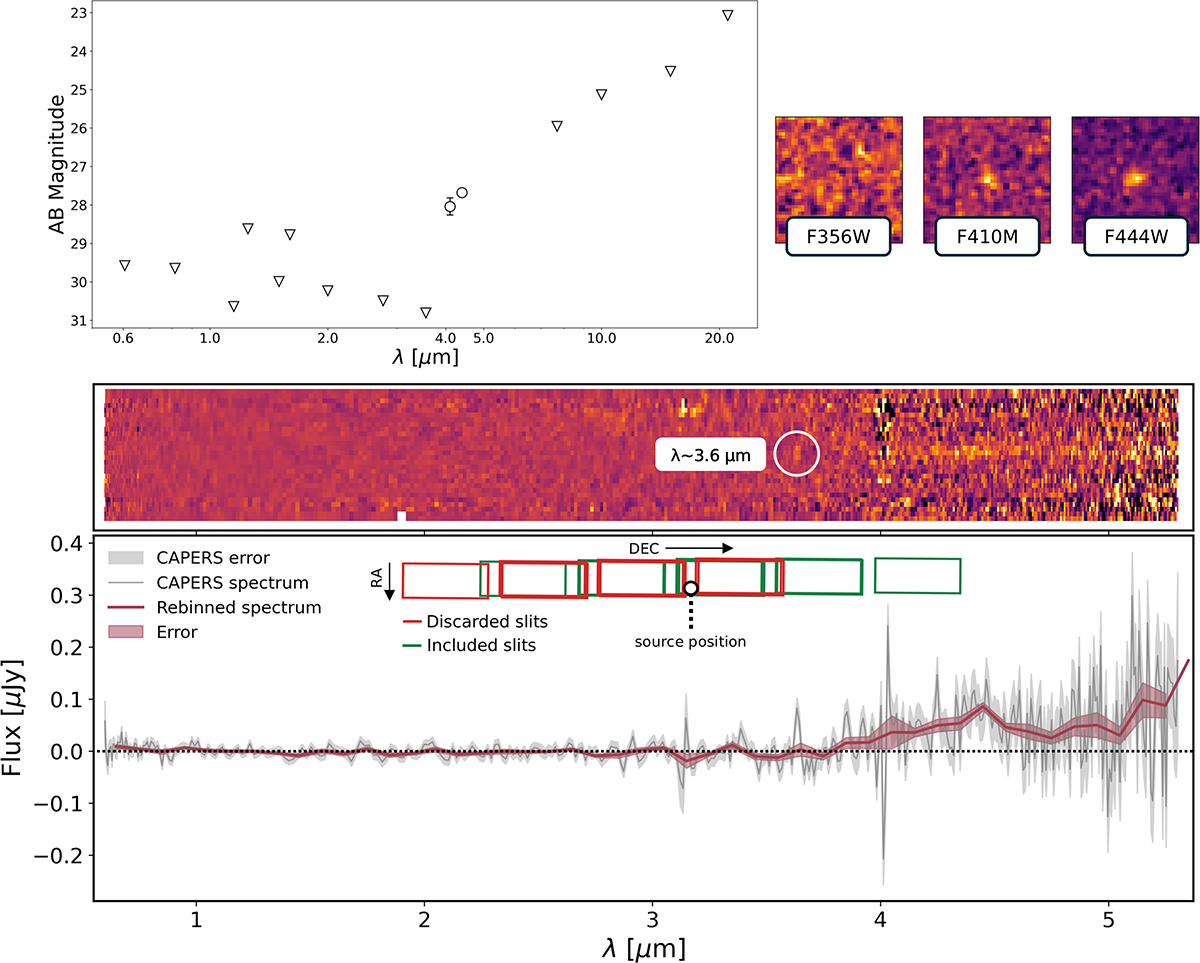
Top panel: Capotauro’s complete JWST and HST photometry in AB magnitudes (left plot), with detections marked as circles and 1σ upper limits as triangles. On the right we report Capotauro’s JWST/NIRCam F356W, F410M, and F444W 1.2″ × 1.2″cutouts (full multi-band single and stacked cutouts are available in Figure B.1). Bottom panel: Capotauro’s 2D JWST/NIRSpec CAPERS spectrum as a function of the observed-frame wavelength. The λ ∼ 3.63 μm potential emission feature is highlighted by a white circle. Below we report the extracted CAPERS spectrum (dark gray line) with 1σ errors (light gray shaded area). The red curve denotes the spectrum rebinned into wavelength bins of width Δλ = 0.1 μm. The surrounding red shaded band illustrates the standard error of the mean in each bin, while the black dashed line marks the zero flux level. The inset displays all the available NIRspec PRISM slits of our CAPERS observations (red for those not containing the source, which were rejected, and green for those containing the source).
Current usage metrics show cumulative count of Article Views (full-text article views including HTML views, PDF and ePub downloads, according to the available data) and Abstracts Views on Vision4Press platform.
Data correspond to usage on the plateform after 2015. The current usage metrics is available 48-96 hours after online publication and is updated daily on week days.
Initial download of the metrics may take a while.