Fig. 2.
Download original image
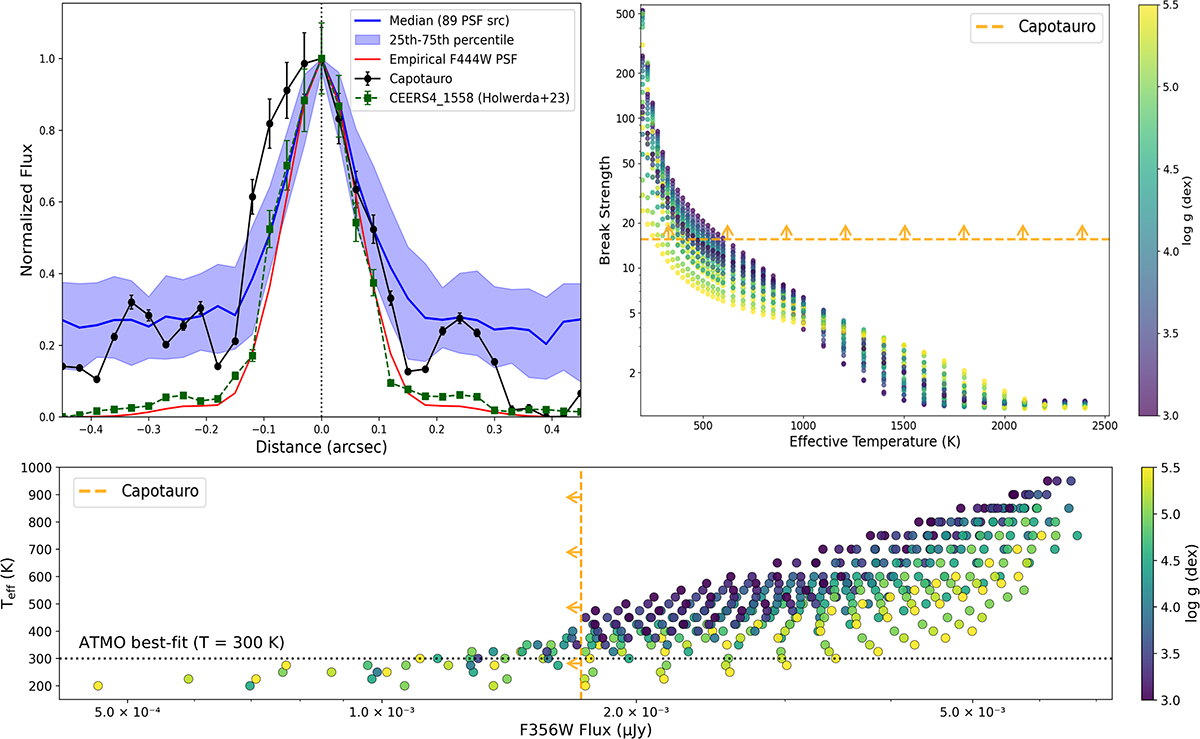
Top Left: Radial profile of Capotauro re-centered to its brightest pixel (black line) compared to the median profile of 89 empirical PSF sources injected in the F444W image and flux-matched to Capotauro (in blue; the shaded area represents the 25–75 percentile range of the 89 profiles). An empirical CEERS F444W PSF profile (red line) is also displayed, as well as a spectroscopically confirmed F444W-detected BD in CEERS (green dashed line; JWST/NIRSpec MSA ID 1558; Holwerda et al. 2024). Uncertainties are calculated as the standard error on the mean flux within concentric 1 px annuli. Top Right: Lower limit on Capotauro’s break strength (dashed orange line) compared to that of the Sonora Cholla cloudless BD atmosphere models (circles) for different effective temperatures, color-coded by their surface gravity value (i.e., log g). Bottom: Rescaled F356W fluxes of the 41 χred2 < 2 Sonora Cholla BD templates versus their effective temperature, color-coded by surface gravitational acceleration. These templates are compared to Capotauro’s 1σ upper limit (orange dashed line). For reference, we provide Capotauro’s ATMO BD template best-fit temperature (T = 300 K), represented as a black dotted line.
Current usage metrics show cumulative count of Article Views (full-text article views including HTML views, PDF and ePub downloads, according to the available data) and Abstracts Views on Vision4Press platform.
Data correspond to usage on the plateform after 2015. The current usage metrics is available 48-96 hours after online publication and is updated daily on week days.
Initial download of the metrics may take a while.