Fig. 5.
Download original image
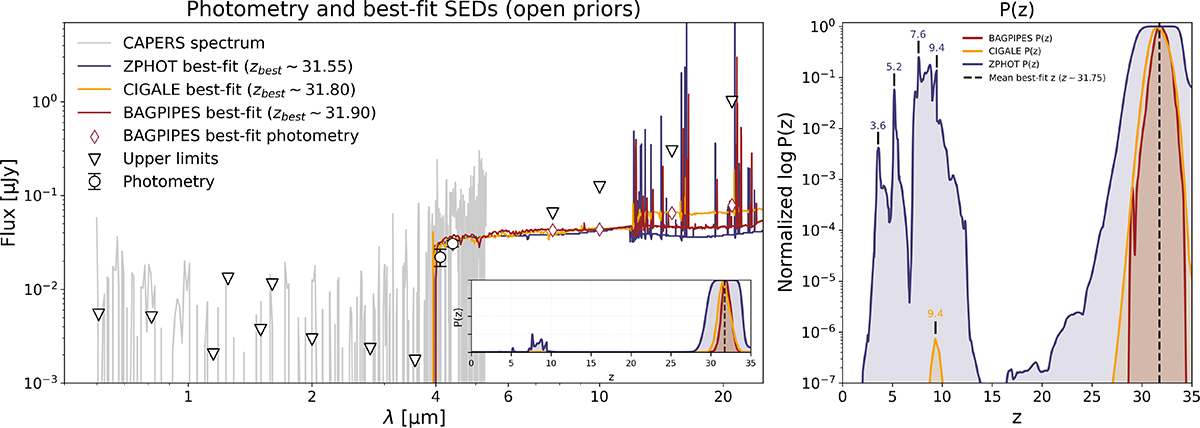
Left panel: Results of our open-redshift SED-fitting runs based on Capotauro’s photometry. Observed fluxes (black dots; 1σ limits as triangles) are compared to the best-fit SEDs from BAGPIPES (red), CIGALE with a Dale et al. (2014) AGN component (yellow), and ZPHOT (purple). The red diamonds indicate synthetic photometry from the BAGPIPES fit. The gray line shows Capotauro’s spectrum from the CAPERS survey. The inset shows the P(z) distributions from all three codes (linear scale). Right panel: Normalized logarithmic redshift probability distribution yielded by BAGPIPES (red), CIGALE (yellow), and ZPHOT (purple). The black dashed line represents the average best-fit redshift between our BAGPIPES, CIGALE, and ZPHOT runs. We report redshift values of secondary P(z) peaks for CIGALE and ZPHOT.
Current usage metrics show cumulative count of Article Views (full-text article views including HTML views, PDF and ePub downloads, according to the available data) and Abstracts Views on Vision4Press platform.
Data correspond to usage on the plateform after 2015. The current usage metrics is available 48-96 hours after online publication and is updated daily on week days.
Initial download of the metrics may take a while.