Fig. 9.
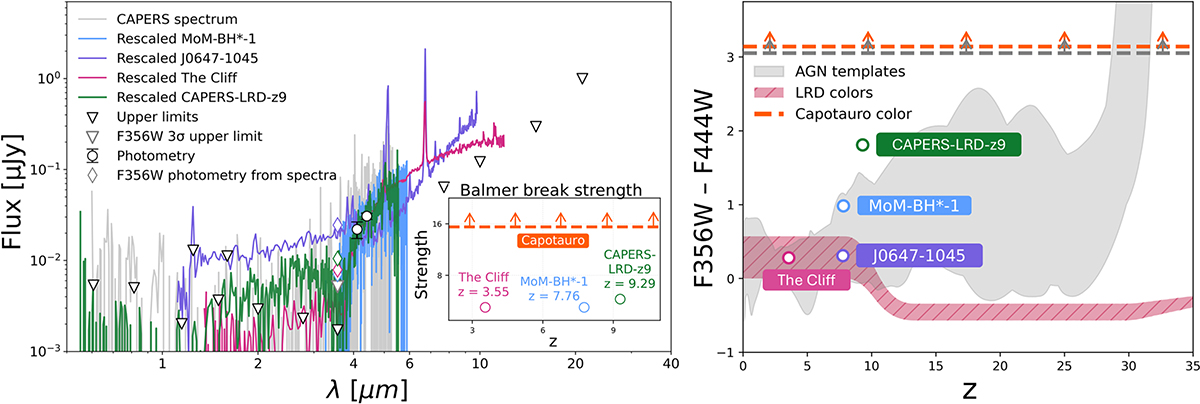
Download original image
Left: Capotauro’s photometry (black circles and black triangles indicating 1σ upper limits) and spectrum (gray line) are compared to the spectra of MoM-BH*-1 (blue), J0647–1045 (purple), the Cliff (pink), and CAPERS-LRD-z9 (green), respectively rescaled to z ∼ 8.92, z ∼ 9.24, z ∼ 9.22, and z ∼ 9.34. These redshifted spectra were also rescaled in flux by factors of ∼0.17, ∼0.22, ∼0.12, and ∼0.26, respectively, to match Capotauro’s photometric detections in the F410M and F444W bands. The F356W synthetic fluxes of each rescaled spectrum are displayed as colored diamonds, compared with Capotauro’s F356W 3σ upper limits (gray diamond) as a reference. The inset displays the measured Balmer break strengths for MoM-BH*-1 (blue circle), the Cliff (pink), CAPERS-LRD-z9 (green), and Capotauro’s lower limit (orange), computed as the ratio of the mean flux in the F444W and F410M bands to the flux in F356W. Right: F356W-F444W color of Capotauro, estimated using the 1σ upper limit from the nondetection in F356W (orange dashed line). A more conservative estimate, adopting the 1σ lower limit of the F444W flux measurement, is shown as a gray dashed line. The colors of MoM-BH*-1 (blue circle), the Cliff (pink), J0647–1045 (purple), and CAPERS-LRD-z9 (green) are compared to those of LRDs (estimated assuming UV/optical slopes within the range from Kocevski et al. 2025) as a function of redshift, along with the predicted AGN colors from the models of Polletta et al. (2007) (gray shaded area).
Current usage metrics show cumulative count of Article Views (full-text article views including HTML views, PDF and ePub downloads, according to the available data) and Abstracts Views on Vision4Press platform.
Data correspond to usage on the plateform after 2015. The current usage metrics is available 48-96 hours after online publication and is updated daily on week days.
Initial download of the metrics may take a while.