Fig. 2
Download original image
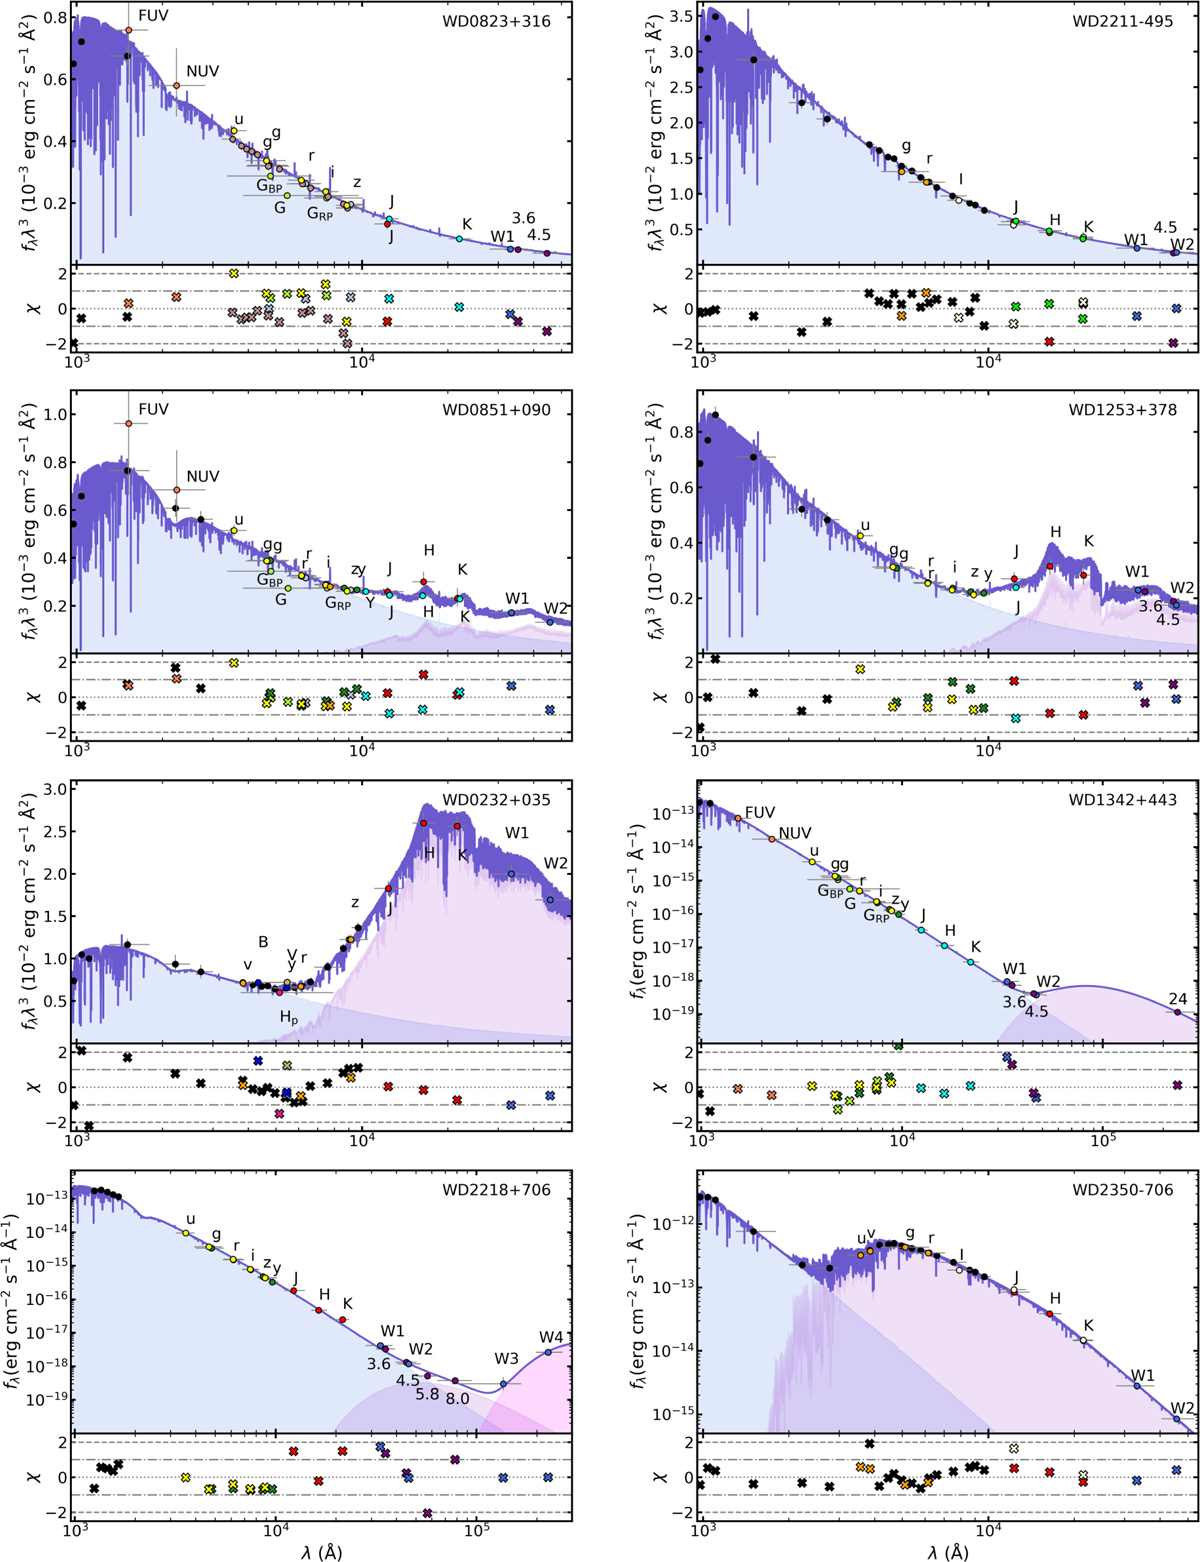
Spectral energy distribution fits to the sample objects (top of each panel) and residuals to the fits (bottom of each panel). The top panels show the SED fits to a DAO (left column) and a DA (right column) WD that do not show an IR excess. The remaining panels (second row: DAO; third and fourth row: DA) depict objects with a near- and/or mid-IR excess modelled with our best fit TMAP models from Paper I and either a best-fit late-type star model from the PHOENIX grid or one or two blackbody component(s). Dots represent observations from different bands, whereas residuals are shown by crosses. Each colour represents a single survey or mission. The dark purple line shows the best-fit (combined) model. Blue and purple areas show the fluxes from the WD and the cool component, respectively. For clarity, the y axis of all panels are shown in the form fλ λ3, except for WD 1342+443, WD 2218+706, and WD 2350–706 where fλ is shown on a logarithmic scale.
Current usage metrics show cumulative count of Article Views (full-text article views including HTML views, PDF and ePub downloads, according to the available data) and Abstracts Views on Vision4Press platform.
Data correspond to usage on the plateform after 2015. The current usage metrics is available 48-96 hours after online publication and is updated daily on week days.
Initial download of the metrics may take a while.