Fig. B.2
Download original image
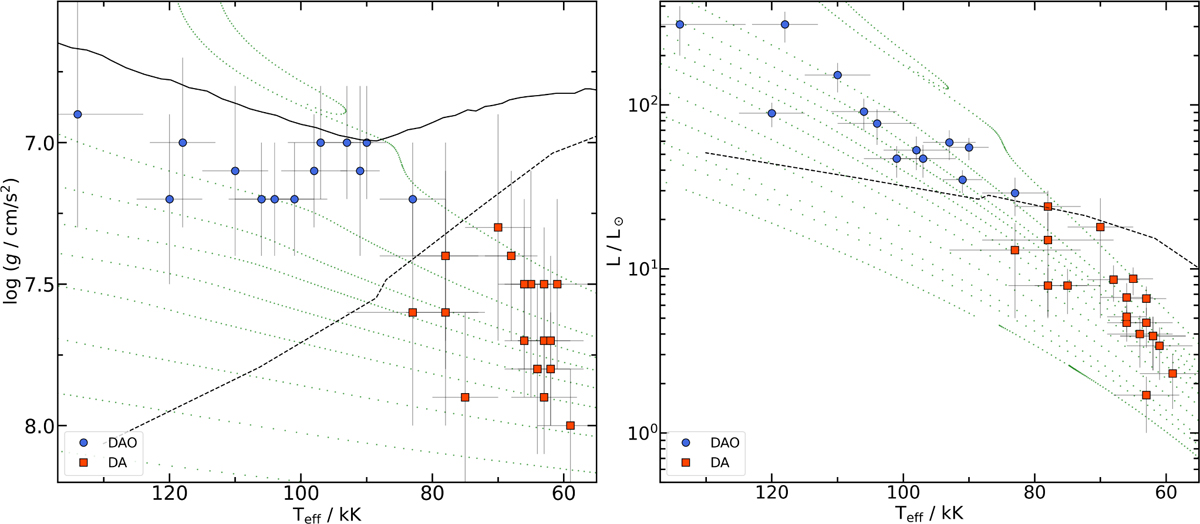
Sample WDs shown in the Kiel diagram (left) and HRD (right). Solid black line in the left panel corresponds to the theoretical wind limit by (Unglaub & Bues 2000). Dashed black lines in both panels represent predicted He abundance (N(He)/N(H) = 10−3) in the cooling sequence by the same authors, which also matches with the approximate optical detection limit of He. Green dotted lines (left: 0.525, 0.570, 0.593, 0.609, 0.632, 0.659, 0.705, 0.767, and 0.837 M⊙, right: 0.525 - 0.935 M⊙) represent evolutionary tracks of H-rich WDs (Z = 0.01) from Renedo et al. (2010).
Current usage metrics show cumulative count of Article Views (full-text article views including HTML views, PDF and ePub downloads, according to the available data) and Abstracts Views on Vision4Press platform.
Data correspond to usage on the plateform after 2015. The current usage metrics is available 48-96 hours after online publication and is updated daily on week days.
Initial download of the metrics may take a while.