Fig. 1.
Download original image
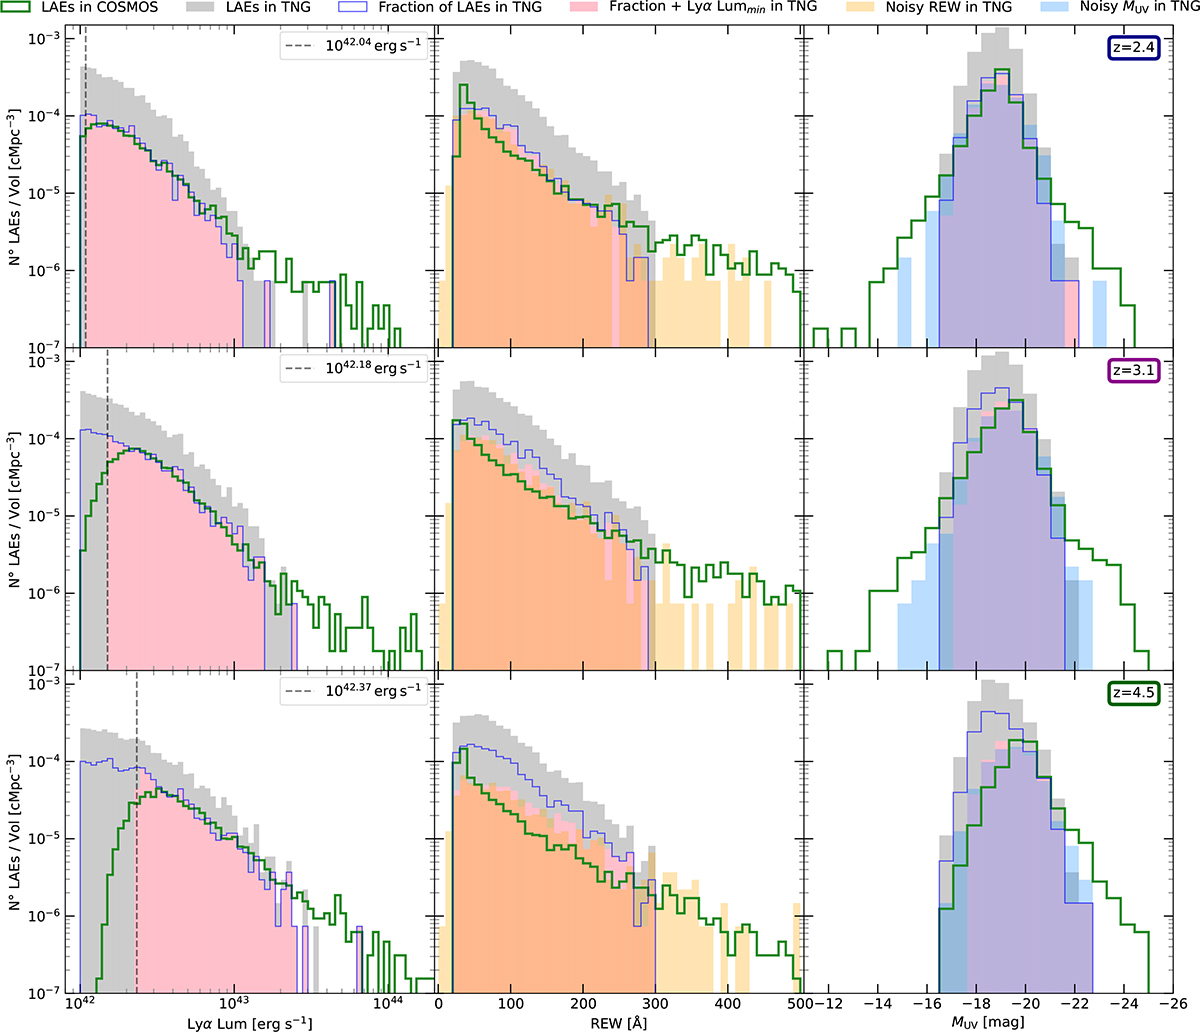
Lyman-alpha luminosity (left panels), REW (middle panels), and UV absolute magnitude (MUV, right panels) distributions per unit volume for redshifts z = 2.4 (top panels), z = 3.1 (middle panels), and z = 4.5 (bottom panels). The solid green line shows the ODIN-COSMOS LAE sample (Lyα Lum ≥ 1042 erg s−1 and REW ≥ 20 Å), while the shaded gray area shows the same sample in the TNG100 simulation. The solid blue line shows a randomly selected subset representing 25%, 33%, and 40% of the LAEs in TNG100 at z = 2.4, 3.1, and 4.5, respectively. The shaded pink areas show the latter samples applying a minimum luminosity cut of 1042.04, 1042.18, and 1042.37 erg s−1 (vertical dashed line shown in the left panels), respectively. The shaded orange areas show the REW distributions noisified by photometric uncertainties, while the sky blue shaded regions show the corresponding noisified MUV distributions (see text).
Current usage metrics show cumulative count of Article Views (full-text article views including HTML views, PDF and ePub downloads, according to the available data) and Abstracts Views on Vision4Press platform.
Data correspond to usage on the plateform after 2015. The current usage metrics is available 48-96 hours after online publication and is updated daily on week days.
Initial download of the metrics may take a while.