Fig. 2.
Download original image
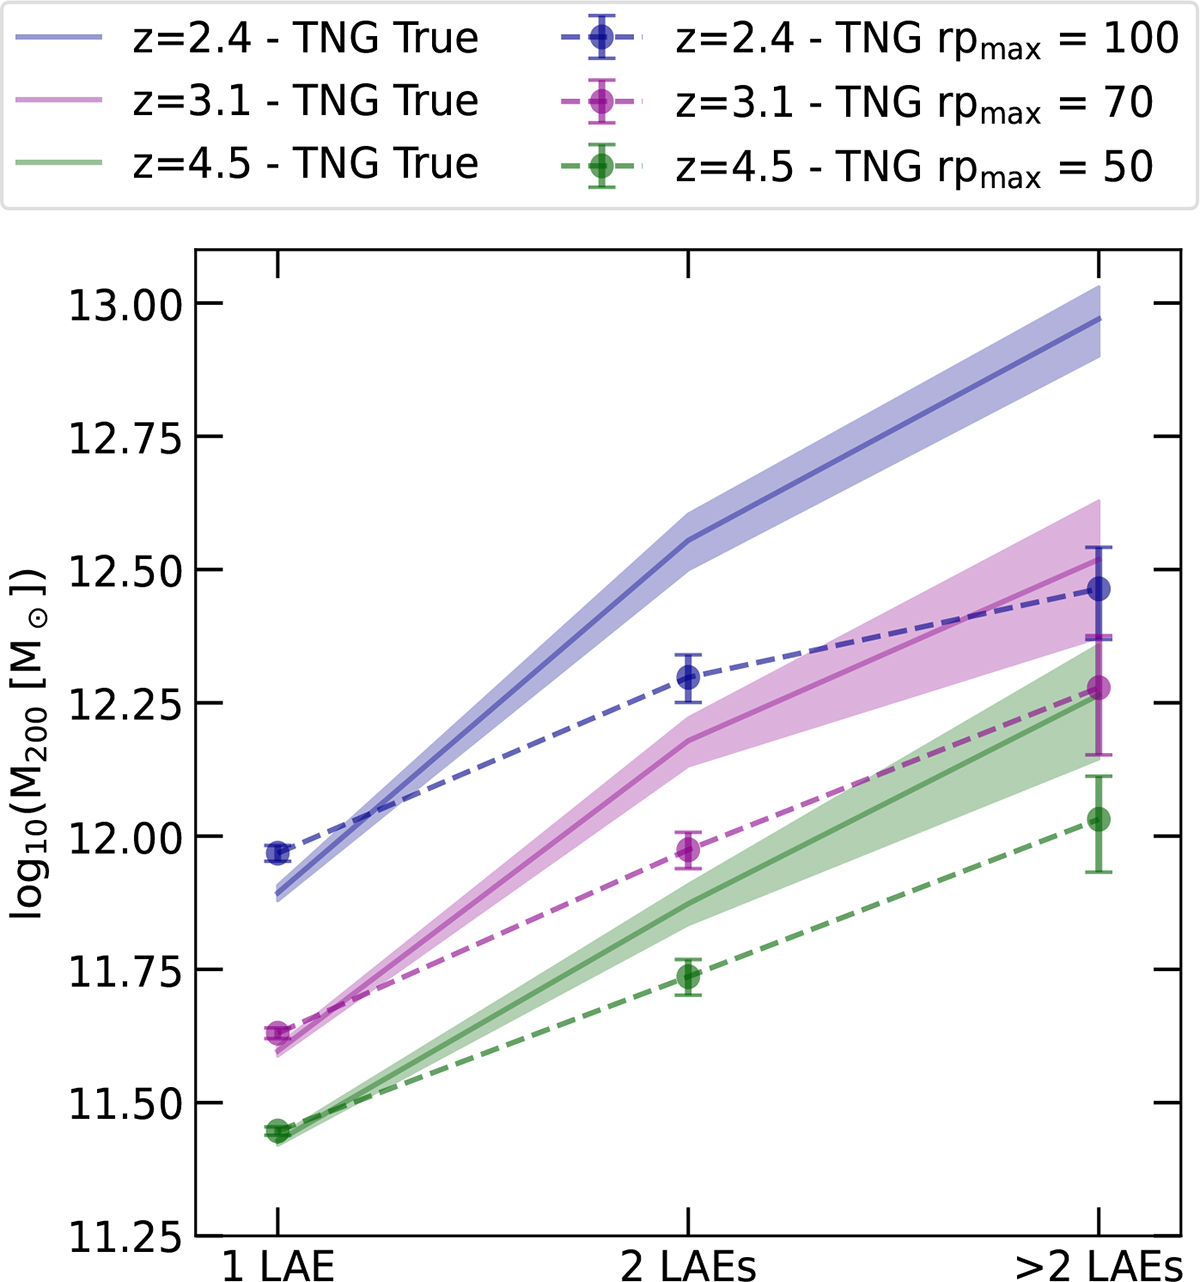
Mean halo mass as a function of the number of LAEs within the halo at z = 2.4 (blue), z = 3.1 (magenta), and z = 4.5 (green). The TNG100 true multiples are shown with solid lines, while the TNG100 multiples identified using projected distances of rpmax = 100 pkpc at z = 2.4, 70 pkpc at z = 3.1 and 50 pkpc at z = 4.5 are displayed using dashed lines. Shaded regions and error bars show the error of the mean. As the number of LAEs in a halo increases, the true mean halo mass also increases, suggesting that the number of physically associated LAEs can serve as a proxy of halo mass. The identified multiples follow the underlying trend more closely at higher redshift.
Current usage metrics show cumulative count of Article Views (full-text article views including HTML views, PDF and ePub downloads, according to the available data) and Abstracts Views on Vision4Press platform.
Data correspond to usage on the plateform after 2015. The current usage metrics is available 48-96 hours after online publication and is updated daily on week days.
Initial download of the metrics may take a while.